
Irish House Price Report Q4 2019 | Daft.ie
Daft Reports
- Ronan Lyons (House Price, Q1 2024)
- Ronan Lyons (Rental Price, Q4 2023)
- Ronan Lyons (House Price, Q4 2023)
- Ronan Lyons (Rental Price, Q3 2023)
- Ronan Lyons (House Price, Q3 2023)
- Ronan Lyons (Rental Price, Q2 2023)
- Ronan Lyons (House Price, Q2 2023)
- Ronan Lyons (Rental Price, Q1 2023)
- Ronan Lyons (House Price, Q1 2023)
- Ronan Lyons (Rental Price, Q4 2022)
- Ronan Lyons (House Price, Q4 2022)
- Ronan Lyons (Rental Price, Q3 2022)
- Ronan Lyons (House Price, Q3 2022)
- Ronan Lyons (Rental Price, Q2 2022)
- Ronan Lyons (House Price, Q2 2022)
- Ronan Lyons (Rental Price, Q1 2022)
- Ronan Lyons (House Price, Q1 2022)
- Ronan Lyons (Rental, Q4 2021)
- Ronan Lyons (House Price, Q4 2021)
- Ronan Lyons (Rental, Q3 2021)
- Ronan Lyons (House Price, Q3 2021)
- Ronan Lyons (Rental, Q2 2021)
- Ronan Lyons (House Price, Q2 2021)
- Ronan Lyons (Rental, Q1 2021)
- Ronan Lyons (House Price, Q1 2021)
- Ronan Lyons (Rental, Q4 2020)
- Ronan Lyons (House Price, Q4 2020)
- Ronan Lyons (Wealth, H2 2020)
- Ronan Lyons (Rental, Q3 2020)
- Ronan Lyons (House Price, Q3 2020)
- Ronan Lyons (Housing, July 2020)
- Ronan Lyons (Housing, June 2020)
- Ronan Lyons (Housing, May 2020)
- Ronan Lyons (Rental, Q1 2020)
- Ronan Lyons (House Price, Q1 2020)
- Ronan Lyons (Rental, Q4 2019)
- Ronan Lyons (House Price, Q4 2019)
- Ronan Lyons (Wealth, H2 2019)
- Ronan Lyons (Rental, Q3 2019)
- Ronan Lyons (House Price, Q3 2019)
- Pierre Yimbog (Rental, Q2 2019)
- Ronan Lyons (House Price, Q2 2019)
- Ronan Lyons (Wealth, H1 2019)
- Ronan Lyons (Rental, Q1 2019)
- Ronan Lyons (House Price, Q1 2019)
- Ronan Lyons (Rental, Q4 2018)
- Ronan Lyons (House Price, Q4 2018)
- Ronan Lyons (Wealth, H2 2018)
- Ronan Lyons (Rental, Q3 2018)
- Ronan Lyons (House Price, Q3 2018)
- Shane De Rís (Rental, Q2 2018)
- Ronan Lyons (House Price, Q2 2018)
- Ronan Lyons (Wealth, 2018)
- Ronan Lyons (Rental, Q1 2018)
- Ronan Lyons (House Price, Q1 2018)
- Ronan Lyons (Rental, Q4 2017)
- Ronan Lyons (House Price, Q4 2017)
- Ronan Lyons (Rental, Q3 2017)
- Ronan Lyons (House Price, Q3 2017)
- Katie Ascough (Rental, Q2 2017)
- Ronan Lyons (Wealth, 2017)
- Ronan Lyons (House Price, Q2 2017)
- Ronan Lyons (Rental, Q1 2017)
- Ronan Lyons (House Price, Q1 2017)
- Ronan Lyons (Rental, Q4 2016)
- Ronan Lyons (House Price, Q4 2016)
- Ronan Lyons (Rental, Q3 2016)
- Ronan Lyons (House Price, Q3 2016)
- Ronan Lyons (School Report, 2016)
- Conor Viscardi (Rental, Q2 2016)
- Ronan Lyons (Rail Report, 2016)
- Ronan Lyons (House Price, Q2 2016)
- Ronan Lyons (Rental, Q1 2016)
- Ronan Lyons (House Price, Q1 2016)
- Ronan Lyons (Rental, Q4 2015)
- Ronan Lyons (House Price, Q4 2015)
- Ronan Lyons (Rental, Q3 2015)
- Ronan Lyons (House Price, Q3 2015)
- Marcus O'Halloran (Rental, Q2 2015)
- Ronan Lyons (House Price, Q2 2015)
- Ronan Lyons (Rental, Q1 2015)
- Ronan Lyons (House Price, Q1 2015)
- Ronan Lyons (Rental, Q4 2014)
- Ronan Lyons (House Price, Q4 2014)
- Ronan Lyons (Rental, Q3 2014)
- Ronan Lyons (House Price, Q3 2014)
- Domhnall McGlacken-Byrne (Rental, Q2 2014)
- Ronan Lyons (House Price, Q2 2014)
- Ronan Lyons (Rental, Q1 2014)
- Ronan Lyons (House Price, Q1 2014)
- Ronan Lyons (Rental, Q4 2013)
- Ronan Lyons (House Price, Q4 2013)
- Ronan Lyons (Rental, Q3 2013)
- Ronan Lyons (House Price, Q3 2013)
- Ronan Lyons (Rental, Q2 2013)
- Ronan Lyons (House Price, Q2 2013)
- Ronan Lyons (Rental, Q1 2013)
- Ronan Lyons (House Price, Q1 2013)
- Ronan Lyons (Rental, Q4 2012)
- Ronan Lyons (House Price, Q4 2012)
- Lorcan Sirr (Rental, Q3 2012)
- Padraic Kenna (House Price, Q3 2012)
- John Logue (Rental, Q2 2012)
- Ronan Lyons (House Price, Q2 2012)
- Barry O'Leary (Rental, Q1 2012)
- Seamus Coffey (House Price, Q1 2012)
- Joan Burton (Rental, Q4 2011)
- Ronan Lyons (House Price, Q4 2011)
- Philip O'Sullivan (Rental, Q3 2011)
- Sheila O'Flanagan (House Price, Q3 2011)
- Rachel Breslin (Rental, Q2 2011)
- Constantin Gurdgiev (House Price, Q2 2011)
- Cormac Lucey (Rental, Q1 2011)
- Eoin Fahy (House Price, Q1 2011)
- Lorcan Roche Kelly (Rental, Q4 2010)
- Ronan Lyons (House Price, Q4 2010)
- John Fitzgerald (Rental, Q3 2010)
- Patrick Koucheravy (House Price, Q3 2010)
- Gary Redmond (Rental, Q2 2010)
- Jim Power (House Price, Q2 2010)
- Jill Kerby (Rental, Q1 2010)
- Brian Lucey (House Price, Q1 2010)
- Michael Taft (Rental, Q4 2009)
- Alan McQuaid (House Price, Q4 2009)
- Dr. Charles J. Larkin (Rental, Q3 2009)
- Emer O'Siochru (House Price, Q3 2009)
- Ronan Lyons (Rental, Q2 2009)
- Oliver Gilvarry (House Price, Q2 2009)
- Brian Devine (Rental, Q1 2009)
- Dr. Liam Delaney (House Price, Q1 2009)
- Gerard O'Neill (Rental, Q4 2008)
- Ronan Lyons (House Price, Q4 2008)
- Dr. Stephen Kinsella (Rental, Q3 2008)
- Moore McDowell (House Price, Q3 2008)
- Shane Kelly (Rental, Q2 2008)
- Fergal O'Brien (House Price, Q2 2008)
- Eoin O'Sullivan (Rental, Q1 2008)
- Dermot O'Leary (House Price, Q1 2008)
- Dan O'Brien (Rental, Q4 2007)
- Frances Ruane (House Price, Q4 2007)
- John McCartney (Rental, Q3 2007)
- Ronnie O'Toole (House Price, Q3 2007)
- Ronan Lyons (Rental, Q2 2007)
- Constantin Gurdgiev (House Price, Q2 2007)
- Fintan McNamara (Rental, Q1 2007)
- Rossa White (House Price, Q1 2007)
- Geoff Tucker (Rental, Q4 2006)
- Damien Kiberd (House Price, Q4 2006)
- Pat McArdle (House Price, Q3 2006)
- Marc Coleman (House Price, Q2 2006)
- David Duffy (House Price, Q1 2006)
- Austin Hughes (House Price, Q4 2005)
- David McWilliams (House Price, Q2 2005)

This marks the final Daft.ie Sales Report of the 2010s. It was a decade that started with rapidly falling prices and closes with gently falling ones. In the first quarter of 2010, sale prices nationally were 17.4% lower than a year previously - just one of 16 consecutive quarters where prices fell by more than 10% in year-on-year terms and the tenth of 24 consecutive quarters where prices were falling.
For the following 24 quarters, from 2013 to 2019, the average listed sale price nationally was higher than it had been a year previously. In other words, the sale price boom lasted as long as the preceding bust: six years. (This, of course, is the national average and the timing varies a little around the country. For example, prices were already rising in year-on-year terms as early as mid-2012 in Dublin 6W but only bottomed out at the end of 2014 in Limerick City.)

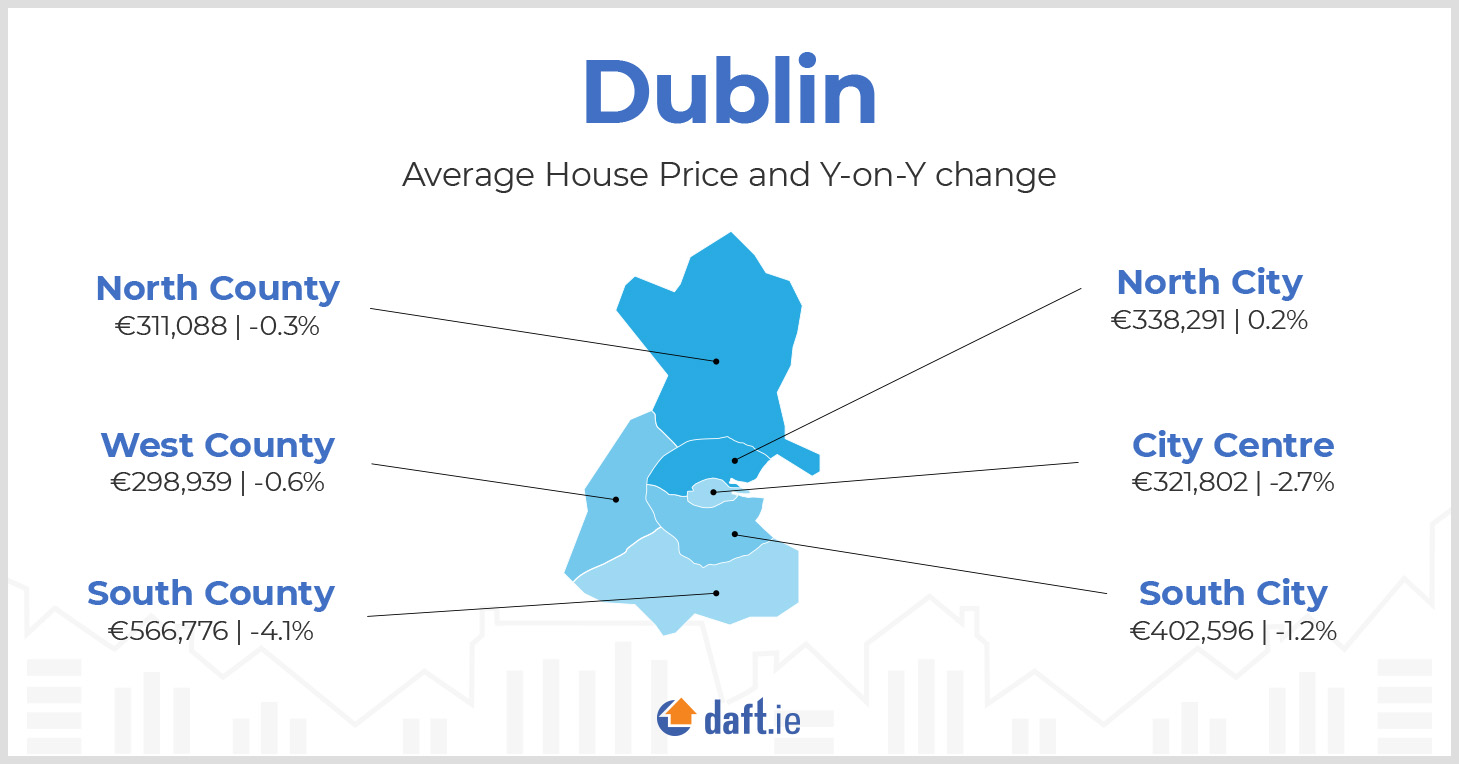
In this, the last report of the decade, the national average listed sale price was - once again, after a six-year break - lower than a year previously. However, the rate of price fall is an order of magnitude different from a decade ago. Prices in late 2019 were 1.2% lower than in late 2018. Indeed, in 18 of the 54 markets covered in the Daft Report, prices are still rising or have started to rise once more. In three central Dublin markets - Dublin 1, 2 and 4 - prices were falling year-on-year earlier in 2019 but are higher than a year ago, as of end-2019.
Together with other figures, these patterns may give us some indication of the likely trends in sale prices for the coming quarters and years. Important clues come from statistics on supply. There were a total of nearly 69,000 properties listed for sale during 2019, up from 52,000 in 2016 and just 33,000 in 2012.
The first wave of that extra supply - from 2012 to 2016 - was largely the second-hand market recovering from the shock of prices halving in the previous five years. The second wave of additional supply is, at least in part, a story of the construction of new homes recovering. There were over 10,000 transactions involving newly-built homes in 2018 and the figure for 2019 looks like being very close to this total. This compares to fewer than 3,000 in 2012.

A decade ago, sale prices in Ireland were halfway through a painful necessary correction following a credit-fuelled bubble that had both real and financial consequences. The real consequences stemmed from an overreliance on construction, both in the general economy and, through its temporary revenues streams, in particular in the public sector. In round numbers, the first half of the 60% fall in sale prices was matched by falls in rents and reflected these real economic consequences.
The financial readjustment needed in Ireland's housing sector a decade ago is most easily seen in a comparison of sale and rental prices. The annual rent as a fraction of the sale price is known as the yield and, being a percentage, can be compared to percentage returns on other assets such as shares and savings accounts. All 'fundamentals' - factors such as employment, demographics and supply - are reflected in rent prices as well as sale prices, so changes in the yield typically reflect financial factors, such as how risky an asset - or an economy - is perceived to be.
For the first three quarters or so of Ireland's century of independence, the yield on housing was above 10%. In other words, people were prepared to pay less than 10 times the annual rent to purchase a home. This relatively high rate reflected initially the relative immaturity of modern mortgage markets and, later, Ireland's relatively peripheral economic status among high-income countries. Entry into the eurozone, especially combined with the rise of the Single European Market, changed this context entirely and the yield fell rapidly.
But the problem was that it was not obvious how low that yield should go. It fell all the way to 3% - in other words, people were paying 30-35 times the annual rent to buy a home. Easy to say in hindsight, not least because other countries were making a similar mistake, if less pronounced, but 3% is too low a yield for what is ultimately a risky asset.
The second half of the nearly 60% fall in sale prices reflects the yield correcting back up to roughly 6%. In other words, sale prices fell by twice as much as rent prices did because of a necessary correction in how risky Irish housing is perceived to be. What is perhaps remarkable is that since 2012, the yield on housing has been remarkably stable, at between 6% and 6.5%.
This tells us that market conditions now are a world away from market conditions a decade ago, despite the superficial similarity in prices falling in both 2009Q4 and 2012Q4. Then, the market was in the middle of a rapid correction, following credit conditions pushing up sale prices too high relative to fundamentals.
Now, if anything, the opposite is true. The sales market looks, by and large, in balance. At least it looks in balance given the mortgage rules, which were introduced precisely to avoid a repeat of the 1995-2012 bubble-crash episode. In that sense, slightly falling sale prices reflects greater affordability and, if housebuilders are becoming more efficient, greater viability.
It is the rental market - home to almost one third of all households in the country - that is home to Ireland's housing issues at the country faces into the 2020s. Its decade in review must, however, wait until the next report.