Accidental gentrification: the curious case of Dublin
Daft Reports
- Ronan Lyons (House Price, Q1 2024)
- Ronan Lyons (Rental Price, Q4 2023)
- Ronan Lyons (House Price, Q4 2023)
- Ronan Lyons (Rental Price, Q3 2023)
- Ronan Lyons (House Price, Q3 2023)
- Ronan Lyons (Rental Price, Q2 2023)
- Ronan Lyons (House Price, Q2 2023)
- Ronan Lyons (Rental Price, Q1 2023)
- Ronan Lyons (House Price, Q1 2023)
- Ronan Lyons (Rental Price, Q4 2022)
- Ronan Lyons (House Price, Q4 2022)
- Ronan Lyons (Rental Price, Q3 2022)
- Ronan Lyons (House Price, Q3 2022)
- Ronan Lyons (Rental Price, Q2 2022)
- Ronan Lyons (House Price, Q2 2022)
- Ronan Lyons (Rental Price, Q1 2022)
- Ronan Lyons (House Price, Q1 2022)
- Ronan Lyons (Rental, Q4 2021)
- Ronan Lyons (House Price, Q4 2021)
- Ronan Lyons (Rental, Q3 2021)
- Ronan Lyons (House Price, Q3 2021)
- Ronan Lyons (Rental, Q2 2021)
- Ronan Lyons (House Price, Q2 2021)
- Ronan Lyons (Rental, Q1 2021)
- Ronan Lyons (House Price, Q1 2021)
- Ronan Lyons (Rental, Q4 2020)
- Ronan Lyons (House Price, Q4 2020)
- Ronan Lyons (Wealth, H2 2020)
- Ronan Lyons (Rental, Q3 2020)
- Ronan Lyons (House Price, Q3 2020)
- Ronan Lyons (Housing, July 2020)
- Ronan Lyons (Housing, June 2020)
- Ronan Lyons (Housing, May 2020)
- Ronan Lyons (Rental, Q1 2020)
- Ronan Lyons (House Price, Q1 2020)
- Ronan Lyons (Rental, Q4 2019)
- Ronan Lyons (House Price, Q4 2019)
- Ronan Lyons (Wealth, H2 2019)
- Ronan Lyons (Rental, Q3 2019)
- Ronan Lyons (House Price, Q3 2019)
- Pierre Yimbog (Rental, Q2 2019)
- Ronan Lyons (House Price, Q2 2019)
- Ronan Lyons (Wealth, H1 2019)
- Ronan Lyons (Rental, Q1 2019)
- Ronan Lyons (House Price, Q1 2019)
- Ronan Lyons (Rental, Q4 2018)
- Ronan Lyons (House Price, Q4 2018)
- Ronan Lyons (Wealth, H2 2018)
- Ronan Lyons (Rental, Q3 2018)
- Ronan Lyons (House Price, Q3 2018)
- Shane De Rís (Rental, Q2 2018)
- Ronan Lyons (House Price, Q2 2018)
- Ronan Lyons (Wealth, 2018)
- Ronan Lyons (Rental, Q1 2018)
- Ronan Lyons (House Price, Q1 2018)
- Ronan Lyons (Rental, Q4 2017)
- Ronan Lyons (House Price, Q4 2017)
- Ronan Lyons (Rental, Q3 2017)
- Ronan Lyons (House Price, Q3 2017)
- Katie Ascough (Rental, Q2 2017)
- Ronan Lyons (Wealth, 2017)
- Ronan Lyons (House Price, Q2 2017)
- Ronan Lyons (Rental, Q1 2017)
- Ronan Lyons (House Price, Q1 2017)
- Ronan Lyons (Rental, Q4 2016)
- Ronan Lyons (House Price, Q4 2016)
- Ronan Lyons (Rental, Q3 2016)
- Ronan Lyons (House Price, Q3 2016)
- Ronan Lyons (School Report, 2016)
- Conor Viscardi (Rental, Q2 2016)
- Ronan Lyons (Rail Report, 2016)
- Ronan Lyons (House Price, Q2 2016)
- Ronan Lyons (Rental, Q1 2016)
- Ronan Lyons (House Price, Q1 2016)
- Ronan Lyons (Rental, Q4 2015)
- Ronan Lyons (House Price, Q4 2015)
- Ronan Lyons (Rental, Q3 2015)
- Ronan Lyons (House Price, Q3 2015)
- Marcus O'Halloran (Rental, Q2 2015)
- Ronan Lyons (House Price, Q2 2015)
- Ronan Lyons (Rental, Q1 2015)
- Ronan Lyons (House Price, Q1 2015)
- Ronan Lyons (Rental, Q4 2014)
- Ronan Lyons (House Price, Q4 2014)
- Ronan Lyons (Rental, Q3 2014)
- Ronan Lyons (House Price, Q3 2014)
- Domhnall McGlacken-Byrne (Rental, Q2 2014)
- Ronan Lyons (House Price, Q2 2014)
- Ronan Lyons (Rental, Q1 2014)
- Ronan Lyons (House Price, Q1 2014)
- Ronan Lyons (Rental, Q4 2013)
- Ronan Lyons (House Price, Q4 2013)
- Ronan Lyons (Rental, Q3 2013)
- Ronan Lyons (House Price, Q3 2013)
- Ronan Lyons (Rental, Q2 2013)
- Ronan Lyons (House Price, Q2 2013)
- Ronan Lyons (Rental, Q1 2013)
- Ronan Lyons (House Price, Q1 2013)
- Ronan Lyons (Rental, Q4 2012)
- Ronan Lyons (House Price, Q4 2012)
- Lorcan Sirr (Rental, Q3 2012)
- Padraic Kenna (House Price, Q3 2012)
- John Logue (Rental, Q2 2012)
- Ronan Lyons (House Price, Q2 2012)
- Barry O'Leary (Rental, Q1 2012)
- Seamus Coffey (House Price, Q1 2012)
- Joan Burton (Rental, Q4 2011)
- Ronan Lyons (House Price, Q4 2011)
- Philip O'Sullivan (Rental, Q3 2011)
- Sheila O'Flanagan (House Price, Q3 2011)
- Rachel Breslin (Rental, Q2 2011)
- Constantin Gurdgiev (House Price, Q2 2011)
- Cormac Lucey (Rental, Q1 2011)
- Eoin Fahy (House Price, Q1 2011)
- Lorcan Roche Kelly (Rental, Q4 2010)
- Ronan Lyons (House Price, Q4 2010)
- John Fitzgerald (Rental, Q3 2010)
- Patrick Koucheravy (House Price, Q3 2010)
- Gary Redmond (Rental, Q2 2010)
- Jim Power (House Price, Q2 2010)
- Jill Kerby (Rental, Q1 2010)
- Brian Lucey (House Price, Q1 2010)
- Michael Taft (Rental, Q4 2009)
- Alan McQuaid (House Price, Q4 2009)
- Dr. Charles J. Larkin (Rental, Q3 2009)
- Emer O'Siochru (House Price, Q3 2009)
- Ronan Lyons (Rental, Q2 2009)
- Oliver Gilvarry (House Price, Q2 2009)
- Brian Devine (Rental, Q1 2009)
- Dr. Liam Delaney (House Price, Q1 2009)
- Gerard O'Neill (Rental, Q4 2008)
- Ronan Lyons (House Price, Q4 2008)
- Dr. Stephen Kinsella (Rental, Q3 2008)
- Moore McDowell (House Price, Q3 2008)
- Shane Kelly (Rental, Q2 2008)
- Fergal O'Brien (House Price, Q2 2008)
- Eoin O'Sullivan (Rental, Q1 2008)
- Dermot O'Leary (House Price, Q1 2008)
- Dan O'Brien (Rental, Q4 2007)
- Frances Ruane (House Price, Q4 2007)
- John McCartney (Rental, Q3 2007)
- Ronnie O'Toole (House Price, Q3 2007)
- Ronan Lyons (Rental, Q2 2007)
- Constantin Gurdgiev (House Price, Q2 2007)
- Fintan McNamara (Rental, Q1 2007)
- Rossa White (House Price, Q1 2007)
- Geoff Tucker (Rental, Q4 2006)
- Damien Kiberd (House Price, Q4 2006)
- Pat McArdle (House Price, Q3 2006)
- Marc Coleman (House Price, Q2 2006)
- David Duffy (House Price, Q1 2006)
- Austin Hughes (House Price, Q4 2005)
- David McWilliams (House Price, Q2 2005)

4th Jul 2016
Ronan Lyons, Daft's in-house economist, commenting on the latest Daft research on the Irish property market.
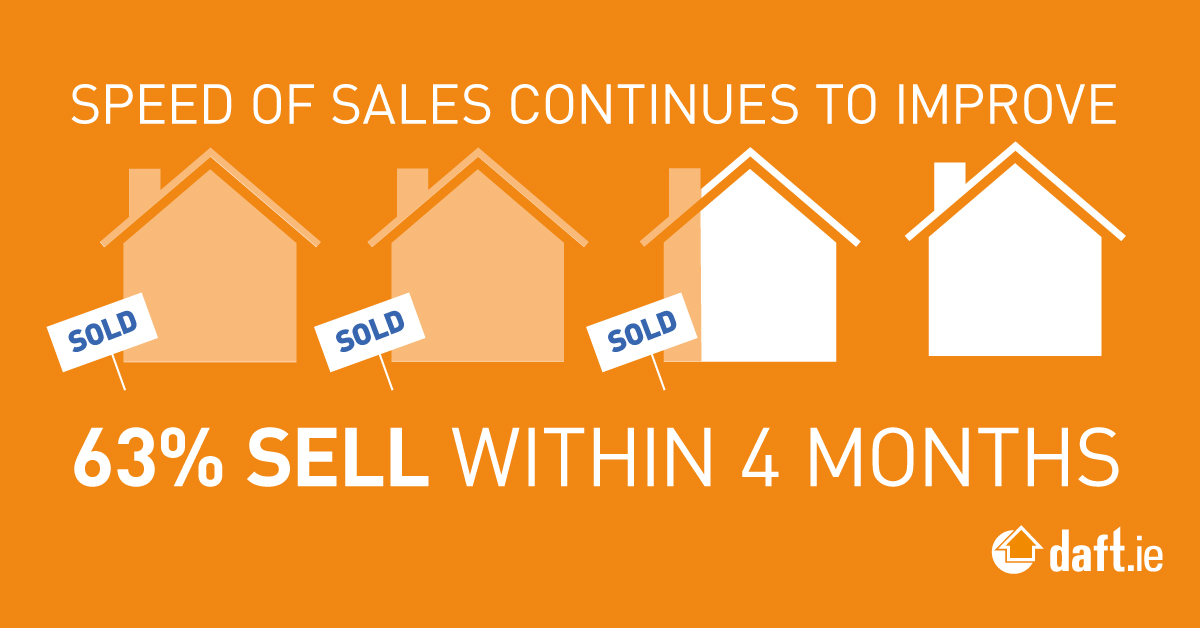
This latest Daft.ie House Price Report shows some signs of health in the market, amid a broader problem of a chronic lack of supply. The first sign of slightly better health is that the total number of properties actively on the market at any one time has risen, compared to three months previously (June compared to March). This is only the second time in five years that this was the case - the first was the same quarter last year, so it remains to be seen whether this is merely seasonal or the start of a bigger trend.
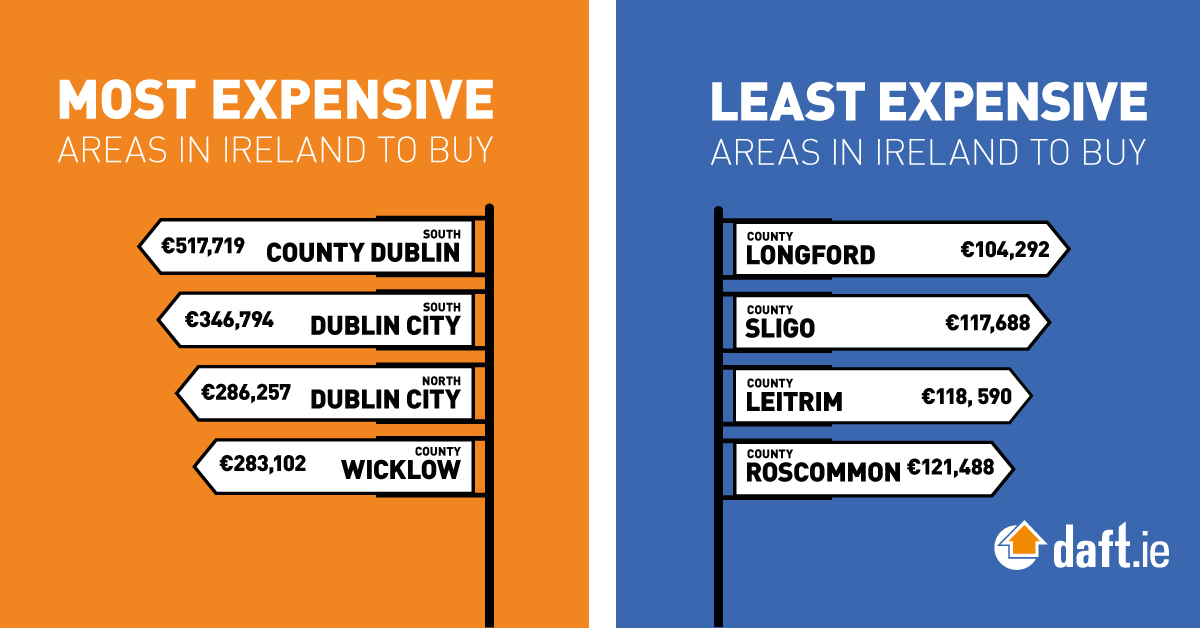
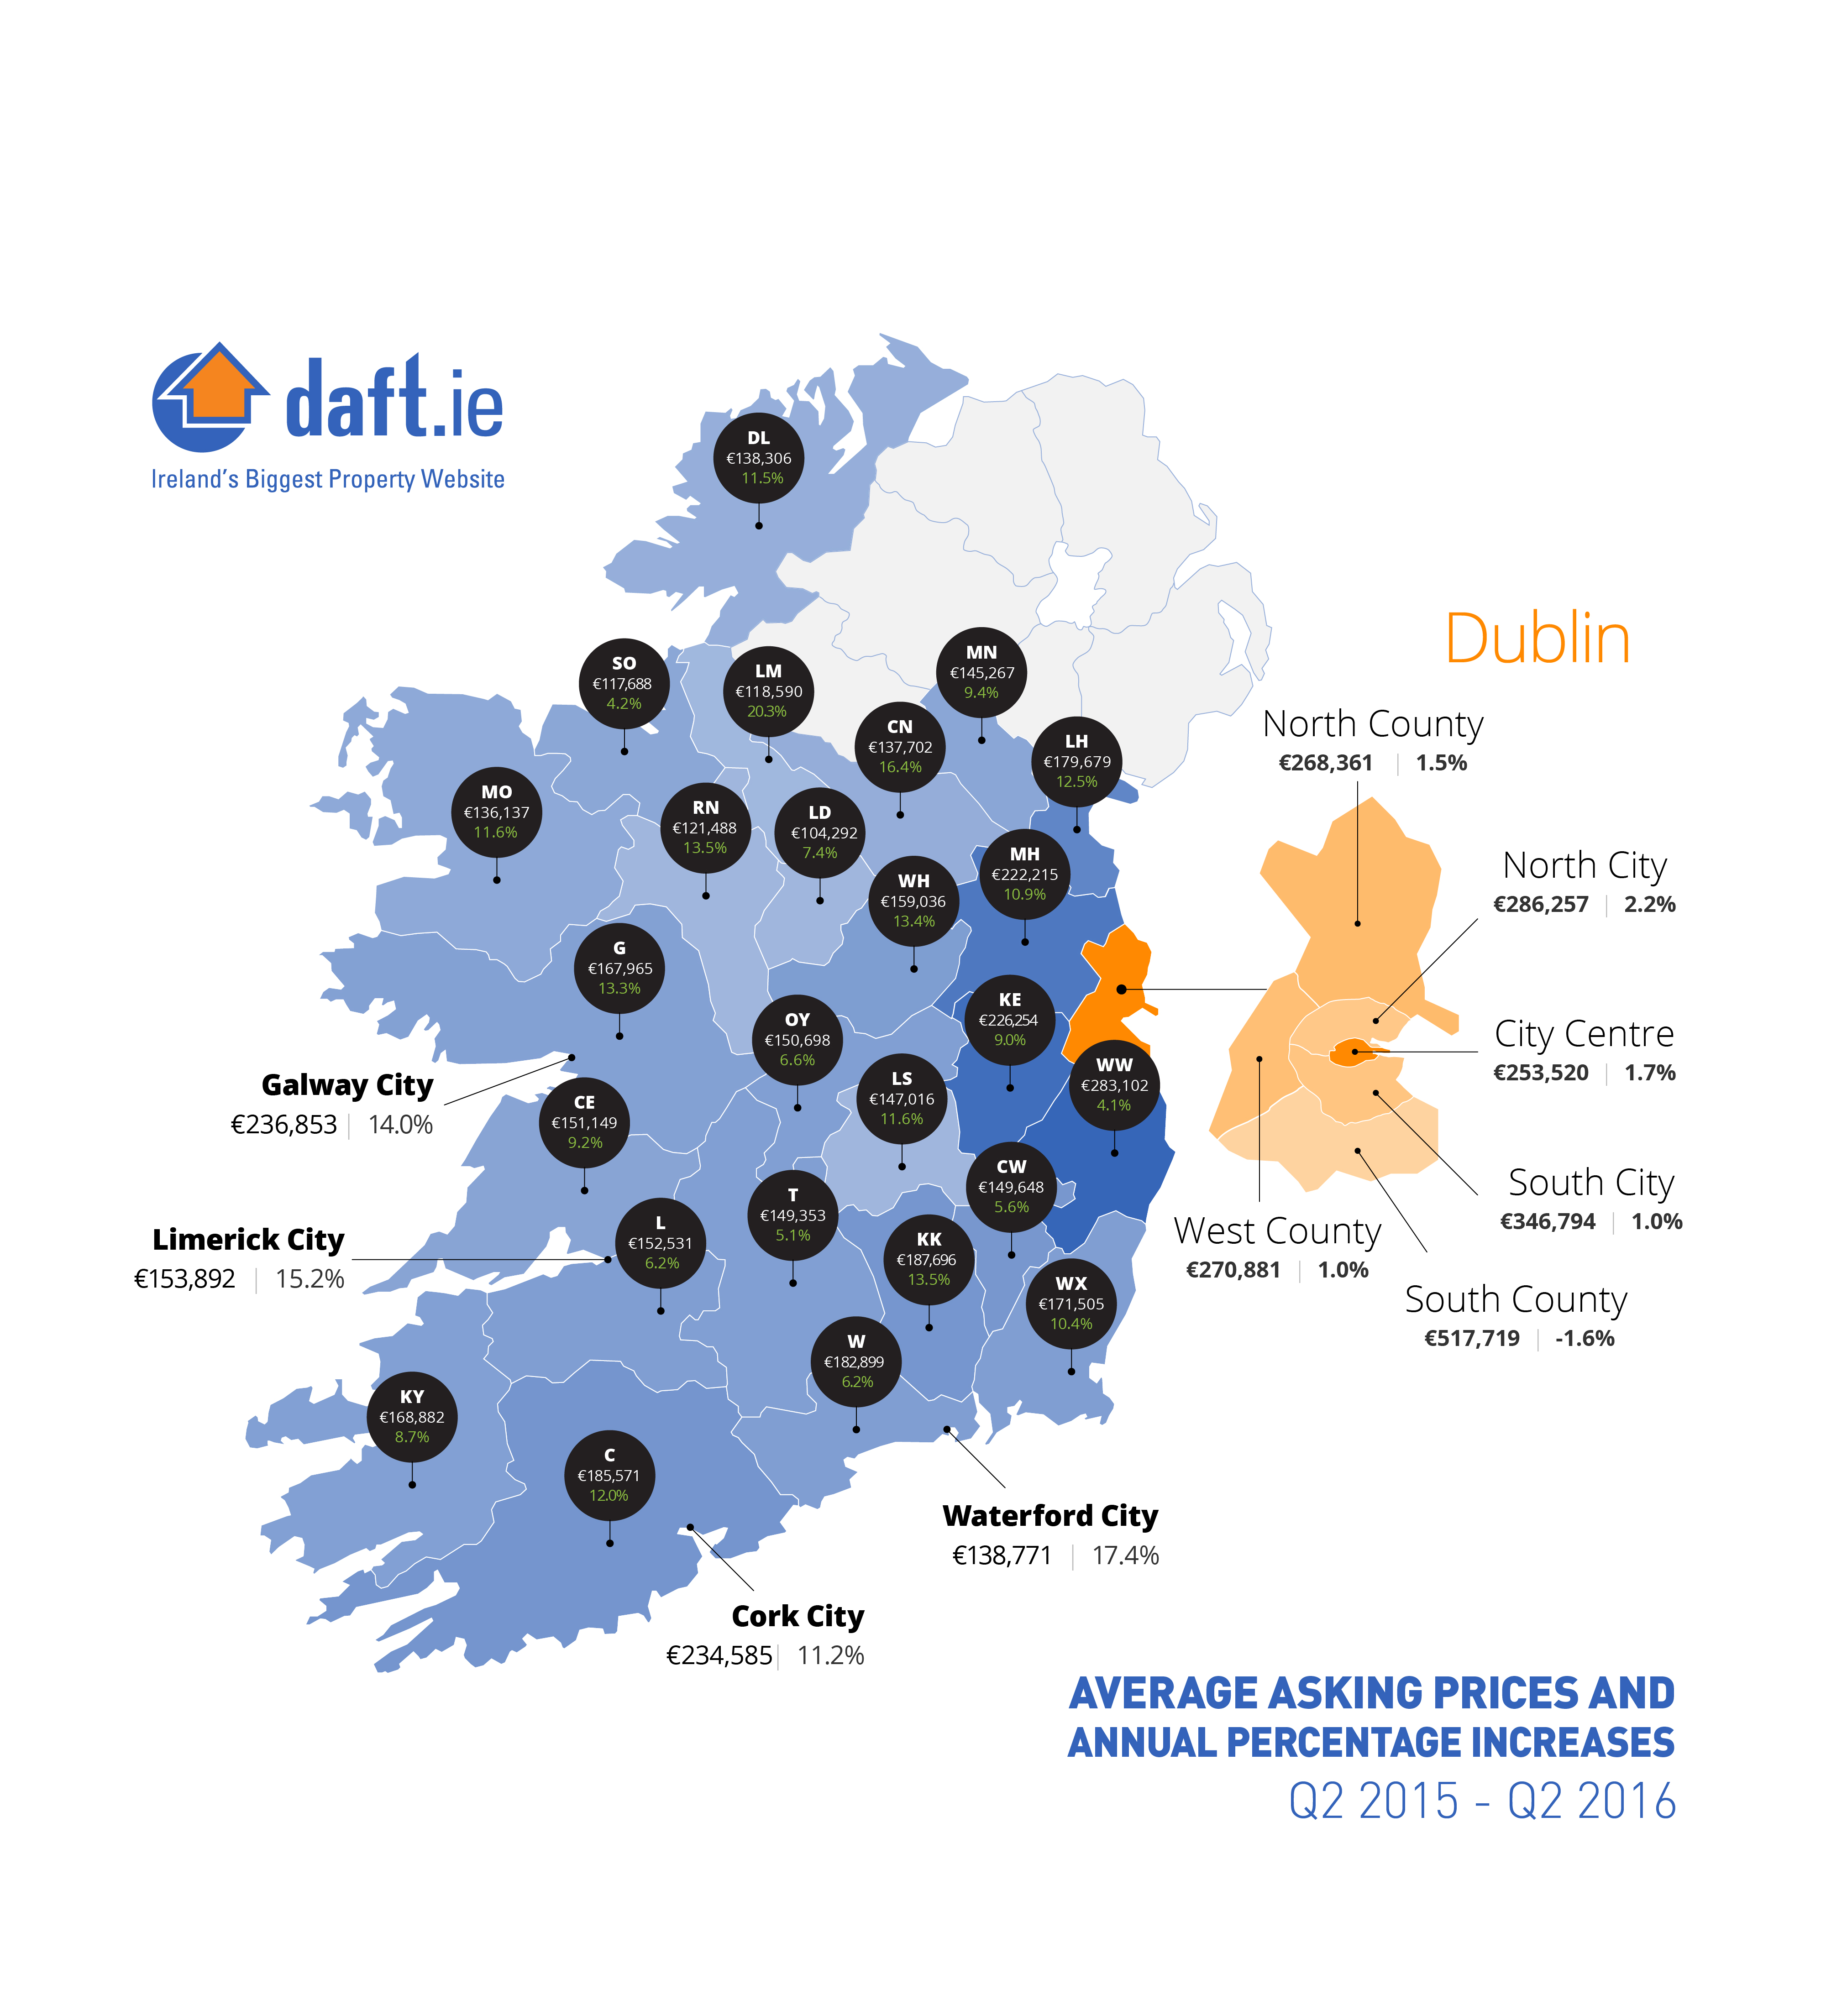
The second measure of slightly improved conditions in the housing market comes from a comparison of the asking and sale prices. Each property registered as sold on the Property Price Register is, where possible, matched up with a listing in the Daft.ie archives. This allows the inclusion of variables such as property type and size and also enables the calculation of the Transaction Price Index in the report. The trends in this index confirm the more precisely estimated trends in list prices in the 54 markets around the country: largely stable prices in Dublin but still increasing steadily elsewhere, albeit not as fast.

But this matching exercise also allows a comparison of the initial listed price and the ultimate transaction price. Where list prices are well above the ultimate transaction prices, this clearly points to a falling market - and this was indeed the case from 2010 on to 2013 in Dublin and into 2014 or 2015 elsewhere. During 2014, however, transaction prices in Dublin were typically more than 5% above the initial listed price, highlighting the opposite problem: a market where buyers have too little choice and push up prices.
Currently, though, across the country as a whole, there is only a 1.5% gap between the ultimate transaction price and the property's initial list price. Coupled with a similar picture last quarter, this represents the closest to healthy the market has been since the start of the decade.
The third indicator of greater health is another quarter where Dublin prices show very muted house price growth. In a healthy housing market, house prices will increase at roughly the same rate as general inflation. In Ireland over the past decade, general inflation has effectively been close to zero, but house prices fell first by 55% before rising by more than 40% in Dublin. Thus, policymakers and others will welcome the fourth consecutive quarter where the annual change in Dublin prices is less than 3%. Indeed, the rate of inflation in Dublin house price now is just 1.1%, the lowest since prices started to rise nearly four years ago.

It is no coincidence that the rate of house price inflation in Dublin fell from 25% to just 1% the time the Central Bank brought in its macroprudential measures, including minimum deposit requirements and loan-to-income restrictions. However, while the primary effect of these rules has been to anchor house prices to real incomes - and this is very much a move in the right direction - there have been secondary effects also.
Perhaps the main secondary effect has been to reshuffle demand from high-cost locations - typically with sought-after amenities such as being near good secondary schools or the coastline - to lower-cost locations that still meet the basic criteria of access to work. While much of this effect has been to push buyers out of Dublin into its commuter counties, there have been important effects within Dublin also.

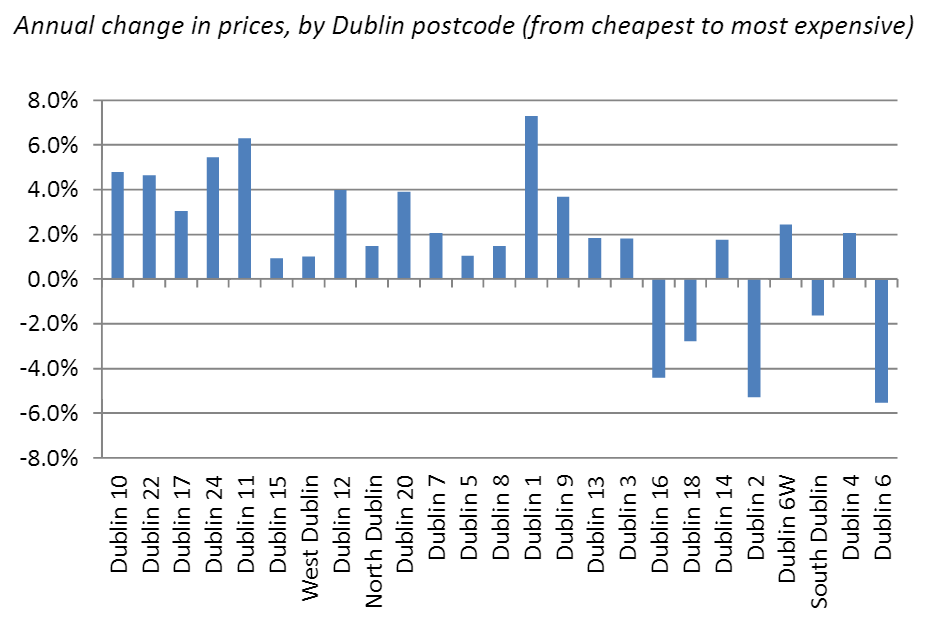
The figure above shows the annual change in average house prices by Dublin postcode. The 25 districts within Dublin are ranked from left to right by how expensive a home is. What is clear is the different trend emerging between the cheapest and dearest areas. The strongest price growth is being seen currently in previously unfashionable postcodes - the market's judgement not mine! - such as Dublin 10 (Ballyfermot), Dublin 12 (Crumlin and Walkinstown), Dublin 17 (Balgriffin) and Dublin 24 (Firhouse and Tallaght). At the other end of the spectrum, five of the most expensive areas of the city are seeing prices fall: Dublin 2, Dublin 6, Dublin 16, Dublin 18 and South County Dublin.
The link between incomes and house prices has forced people to reconsider some of their implicit assumptions about where to look when buying a home - leading to what might be termed 'accidental gentrification'. This will undoubtedly have some positive effects, not least if affluent Dubliners become more familiar with the city they live in and some of their purchasing power refreshes some Dublin suburbs.
But there are clear risks also. Primary among them is that lower-income households become priced out of the entire city within the M50. When it comes to housing, the Central Bank's only real responsibility is the financial stability of the system as a whole. It has no remit to increase supply. But without the rest of the policy system responding - through for example relaxing land use restrictions and lowering construction costs - the Central Bank rules could combine with prohibitive site and construction costs to make Dublin into an enclave for the rich.

