
Taking stock of Ireland's property market, five years into the crash
Daft Reports
- Ronan Lyons (House Price, Q1 2024)
- Ronan Lyons (Rental Price, Q4 2023)
- Ronan Lyons (House Price, Q4 2023)
- Ronan Lyons (Rental Price, Q3 2023)
- Ronan Lyons (House Price, Q3 2023)
- Ronan Lyons (Rental Price, Q2 2023)
- Ronan Lyons (House Price, Q2 2023)
- Ronan Lyons (Rental Price, Q1 2023)
- Ronan Lyons (House Price, Q1 2023)
- Ronan Lyons (Rental Price, Q4 2022)
- Ronan Lyons (House Price, Q4 2022)
- Ronan Lyons (Rental Price, Q3 2022)
- Ronan Lyons (House Price, Q3 2022)
- Ronan Lyons (Rental Price, Q2 2022)
- Ronan Lyons (House Price, Q2 2022)
- Ronan Lyons (Rental Price, Q1 2022)
- Ronan Lyons (House Price, Q1 2022)
- Ronan Lyons (Rental, Q4 2021)
- Ronan Lyons (House Price, Q4 2021)
- Ronan Lyons (Rental, Q3 2021)
- Ronan Lyons (House Price, Q3 2021)
- Ronan Lyons (Rental, Q2 2021)
- Ronan Lyons (House Price, Q2 2021)
- Ronan Lyons (Rental, Q1 2021)
- Ronan Lyons (House Price, Q1 2021)
- Ronan Lyons (Rental, Q4 2020)
- Ronan Lyons (House Price, Q4 2020)
- Ronan Lyons (Wealth, H2 2020)
- Ronan Lyons (Rental, Q3 2020)
- Ronan Lyons (House Price, Q3 2020)
- Ronan Lyons (Housing, July 2020)
- Ronan Lyons (Housing, June 2020)
- Ronan Lyons (Housing, May 2020)
- Ronan Lyons (Rental, Q1 2020)
- Ronan Lyons (House Price, Q1 2020)
- Ronan Lyons (Rental, Q4 2019)
- Ronan Lyons (House Price, Q4 2019)
- Ronan Lyons (Wealth, H2 2019)
- Ronan Lyons (Rental, Q3 2019)
- Ronan Lyons (House Price, Q3 2019)
- Pierre Yimbog (Rental, Q2 2019)
- Ronan Lyons (House Price, Q2 2019)
- Ronan Lyons (Wealth, H1 2019)
- Ronan Lyons (Rental, Q1 2019)
- Ronan Lyons (House Price, Q1 2019)
- Ronan Lyons (Rental, Q4 2018)
- Ronan Lyons (House Price, Q4 2018)
- Ronan Lyons (Wealth, H2 2018)
- Ronan Lyons (Rental, Q3 2018)
- Ronan Lyons (House Price, Q3 2018)
- Shane De Rís (Rental, Q2 2018)
- Ronan Lyons (House Price, Q2 2018)
- Ronan Lyons (Wealth, 2018)
- Ronan Lyons (Rental, Q1 2018)
- Ronan Lyons (House Price, Q1 2018)
- Ronan Lyons (Rental, Q4 2017)
- Ronan Lyons (House Price, Q4 2017)
- Ronan Lyons (Rental, Q3 2017)
- Ronan Lyons (House Price, Q3 2017)
- Katie Ascough (Rental, Q2 2017)
- Ronan Lyons (Wealth, 2017)
- Ronan Lyons (House Price, Q2 2017)
- Ronan Lyons (Rental, Q1 2017)
- Ronan Lyons (House Price, Q1 2017)
- Ronan Lyons (Rental, Q4 2016)
- Ronan Lyons (House Price, Q4 2016)
- Ronan Lyons (Rental, Q3 2016)
- Ronan Lyons (House Price, Q3 2016)
- Ronan Lyons (School Report, 2016)
- Conor Viscardi (Rental, Q2 2016)
- Ronan Lyons (Rail Report, 2016)
- Ronan Lyons (House Price, Q2 2016)
- Ronan Lyons (Rental, Q1 2016)
- Ronan Lyons (House Price, Q1 2016)
- Ronan Lyons (Rental, Q4 2015)
- Ronan Lyons (House Price, Q4 2015)
- Ronan Lyons (Rental, Q3 2015)
- Ronan Lyons (House Price, Q3 2015)
- Marcus O'Halloran (Rental, Q2 2015)
- Ronan Lyons (House Price, Q2 2015)
- Ronan Lyons (Rental, Q1 2015)
- Ronan Lyons (House Price, Q1 2015)
- Ronan Lyons (Rental, Q4 2014)
- Ronan Lyons (House Price, Q4 2014)
- Ronan Lyons (Rental, Q3 2014)
- Ronan Lyons (House Price, Q3 2014)
- Domhnall McGlacken-Byrne (Rental, Q2 2014)
- Ronan Lyons (House Price, Q2 2014)
- Ronan Lyons (Rental, Q1 2014)
- Ronan Lyons (House Price, Q1 2014)
- Ronan Lyons (Rental, Q4 2013)
- Ronan Lyons (House Price, Q4 2013)
- Ronan Lyons (Rental, Q3 2013)
- Ronan Lyons (House Price, Q3 2013)
- Ronan Lyons (Rental, Q2 2013)
- Ronan Lyons (House Price, Q2 2013)
- Ronan Lyons (Rental, Q1 2013)
- Ronan Lyons (House Price, Q1 2013)
- Ronan Lyons (Rental, Q4 2012)
- Ronan Lyons (House Price, Q4 2012)
- Lorcan Sirr (Rental, Q3 2012)
- Padraic Kenna (House Price, Q3 2012)
- John Logue (Rental, Q2 2012)
- Ronan Lyons (House Price, Q2 2012)
- Barry O'Leary (Rental, Q1 2012)
- Seamus Coffey (House Price, Q1 2012)
- Joan Burton (Rental, Q4 2011)
- Ronan Lyons (House Price, Q4 2011)
- Philip O'Sullivan (Rental, Q3 2011)
- Sheila O'Flanagan (House Price, Q3 2011)
- Rachel Breslin (Rental, Q2 2011)
- Constantin Gurdgiev (House Price, Q2 2011)
- Cormac Lucey (Rental, Q1 2011)
- Eoin Fahy (House Price, Q1 2011)
- Lorcan Roche Kelly (Rental, Q4 2010)
- Ronan Lyons (House Price, Q4 2010)
- John Fitzgerald (Rental, Q3 2010)
- Patrick Koucheravy (House Price, Q3 2010)
- Gary Redmond (Rental, Q2 2010)
- Jim Power (House Price, Q2 2010)
- Jill Kerby (Rental, Q1 2010)
- Brian Lucey (House Price, Q1 2010)
- Michael Taft (Rental, Q4 2009)
- Alan McQuaid (House Price, Q4 2009)
- Dr. Charles J. Larkin (Rental, Q3 2009)
- Emer O'Siochru (House Price, Q3 2009)
- Ronan Lyons (Rental, Q2 2009)
- Oliver Gilvarry (House Price, Q2 2009)
- Brian Devine (Rental, Q1 2009)
- Dr. Liam Delaney (House Price, Q1 2009)
- Gerard O'Neill (Rental, Q4 2008)
- Ronan Lyons (House Price, Q4 2008)
- Dr. Stephen Kinsella (Rental, Q3 2008)
- Moore McDowell (House Price, Q3 2008)
- Shane Kelly (Rental, Q2 2008)
- Fergal O'Brien (House Price, Q2 2008)
- Eoin O'Sullivan (Rental, Q1 2008)
- Dermot O'Leary (House Price, Q1 2008)
- Dan O'Brien (Rental, Q4 2007)
- Frances Ruane (House Price, Q4 2007)
- John McCartney (Rental, Q3 2007)
- Ronnie O'Toole (House Price, Q3 2007)
- Ronan Lyons (Rental, Q2 2007)
- Constantin Gurdgiev (House Price, Q2 2007)
- Fintan McNamara (Rental, Q1 2007)
- Rossa White (House Price, Q1 2007)
- Geoff Tucker (Rental, Q4 2006)
- Damien Kiberd (House Price, Q4 2006)
- Pat McArdle (House Price, Q3 2006)
- Marc Coleman (House Price, Q2 2006)
- David Duffy (House Price, Q1 2006)
- Austin Hughes (House Price, Q4 2005)
- David McWilliams (House Price, Q2 2005)

2nd Jul 2012
Ronan Lyons, Daft's in-house economist, commenting on the latest Daft research on the Irish property market.
Taking stock, five years on
Although the first signs of the slowdown in the Irish property market date back to the Daft.ie Report of mid-2006, the start of Ireland's property market crash is typically dated from when property prices started to fall in the second quarter of 2007. This quarter's report, which marks five years of falling prices, and the 50th Daft.ie House Price Report, presents an opportunity to take stock on what has happened and what that can tell us about the future.
Ireland in perspective
Already, Ireland's property crash is recognised as one of the most severe ever experienced by a modern developed economy. OECD research suggests that the typical housing market downturn lasts over four and a half years, so the crash is already longer than the usual one. Not only is it longer however, it is also sharper. During the typical OECD housing market downturn, the fall in prices is 23%. According to the latest Daft.ie Report, the average fall from the peak nationwide has been 53%.
An average, however, can hide all-important details. For example, in the U.S., the median house price has fallen 20% since 2006. However, to focus on the 20% is to ignore the hugely different experiences across each of 140 metropolitan areas . According to U.S. realtor figures, in 27 cities, including San Antonio and Amarillo in Texas, the median price has actually risen in those six years. Conversely, in high-profile cities such as Phoenix, Orlando, Las Vegas and LA, prices have fallen by more than 50%. In Detroit, the average house price has fallen 66% in the last six years.
Over the last few years, daft.ie has built up a huge dataset of property listings - over 1.1 million lettings ads and 660,000 sales listings since the start of 2006. Tens of thousands of new listings are used each quarter in the daft.ie reports on the sales and lettings markets. But the sample in its entirety can also be used to take stock and see what structural changes have happened in the Irish property market since the final stages of the bubble.
Mapping changes in the Irish market
Since the start of the year, I have been working with the National Institute for Regional & Spatial Analysis at NUI Maynooth analysing Ireland's property market since 2006. The approach involved using the address of each listing to map all the ads as accurately as possible and then breaking the country down into as many zones as possible. These zones were built up from the 4,500 Census districts in the country (enumerator areas in the cities, electoral divisions elsewhere). These districts were added together until each zone had enough listings in both the bubble and crash period to estimate where it fits in the nationwide spread of prices (and rents), both in 2007 and in 2012. Maps of house prices and rents in 2007 and now are available at daft.ie/research.
The models of house prices used - which are explained in more detail in a working paper available here - point to some important adjustments that have taken place in the housing market since the end of the bubble. They also highlight important differences between the sales market and the lettings market. The obvious difference between prices and rents is that the typical fall in prices (54.5% according to the most thorough model developed) has been almost twice the size of that in the rents (29.4%). As a result, the rent-to-price ratio (or 'yield', which is also mapped for each of the 4,500 Census districts) has increased from historic lows in 2007 (3.5% on average) to 5.5% in 2012.
However, that is not the only significant difference between prices and rents. While the spread of rents has narrowed, the spread of house prices has if anything increased. The easiest way to think about this is to look at the p remium associated with a particular property size. During the latter stages of the bubble, the average difference between a four-bedroom property and a two-bedroom property in the same location was 45%. Since 2009, though, it has increased to 58%. As shown in the figure below, this increasing premium associated with space holds true for property types (e.g. detached versus apartment) as well as for property sizes.
Premium associated with certain property types (national average), for different periods
The increase in the price of space since the bubble ended is the opposite of what has happened in rents, where there has been greater compression in rents. In one sense, this runs counter to people's intuitions - surely after a bubble, the more expensive properties will be hit most? The figures suggest, though, that the bubble was characterised by what could be termed a "property ladder" effect: people disregarded where they wanted to buy long-term, which pushed up the price of smaller properties, including one and two-bedroom apartments and terraced properties.
What these maps mean for the future
Five years into Ireland's property market crash, and prices continue to fall. According to the latest Daft.ie Report, the average asking price fell 2.6% in the second quarter of 2012, compared to 1.4% in the first quarter and an average quarterly fall of 4.3% during the period 2008-2011. Dublin prices have fallen by most - but as the maps show, this may be due to smaller properties seeing their prices fall by more on average.
In general, the signs from the Dublin property market are much healthier. The average asking price in Dublin in June (€214,000) was quite close to that in December (€217,000), while the average price outside the major cities fell from €162,000 to €149,000 in the same period. But it is important to remember that recovery in the property market is not about prices - it will take over four decades of "normal" house price inflation of 2% to reach the prices last seen in 2007 - rather, recovery is about activity.
Measures of activity in the Daft Report also suggest that the Dublin market is improving. The stock available for sale in Dublin, at just over 4,600, has fallen 35% from its peak of late 2008 and is only 18% above the levels of early 2007. In June, 34% of properties that were put on the market two months previously had sold - up from 25% last December. All these figures suggest that the Dublin market is closest to being a normal property market again.
Outside the major cities, though, it does not look like the property market adjustment has completed. Not only are prices still falling, oversupply is still an issue: there are still twice as many properties for sale now as in early 2007 (16,000 compared to 8,000). Unlike Dublin, there has been little change in the number of properties selling within two or four months. In Connacht-Ulster, just 12% of properties find a buyer within two months, a fraction that has not changed since the start of the year.
People will want to live near cities, which will drive most jobs growth. This demand-side factor will compound supply-side differences. A large oversupply in some areas and in some property types, such as apartments and terraced homes, will only slowly fade away, while urban areas may need construction of new family homes soon. While confidence and credit are of course important national factors, over coming years, Ireland's property market will be characterised by these differences. Policymakers, both national and local, ignore them at their peril.
HIGHLIGHTS: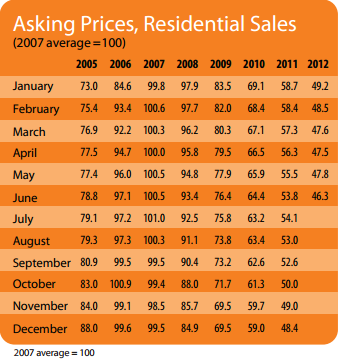
Asking Prices, Residential Sales
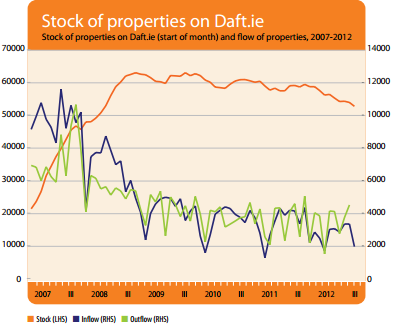
Stock and Flow of Sale Properties
SNAPSHOT:
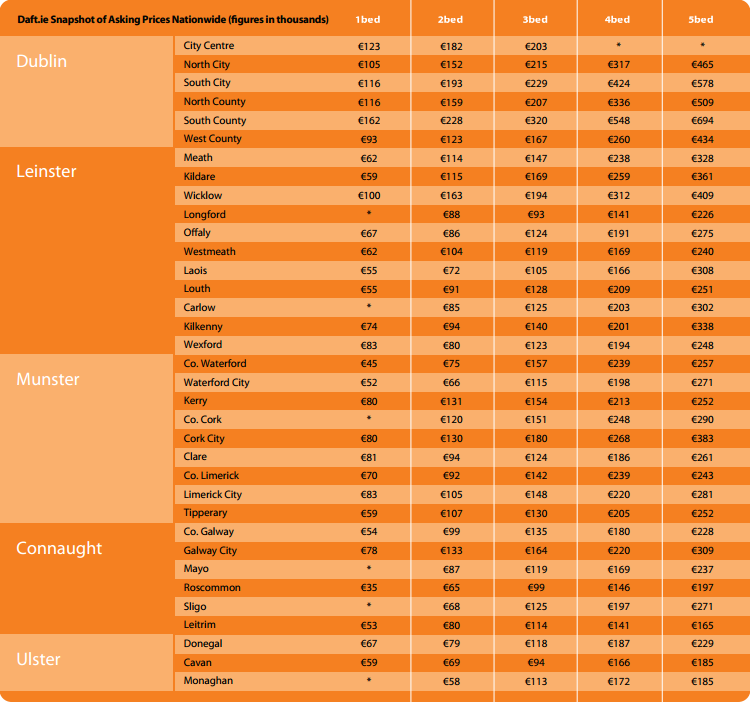
Snapshot of Asking Prices Nationwide