Irish House Price Report Q4 2022 | Daft.ie
Daft Reports
- Ronan Lyons (House Price, Q1 2024)
- Ronan Lyons (Rental Price, Q4 2023)
- Ronan Lyons (House Price, Q4 2023)
- Ronan Lyons (Rental Price, Q3 2023)
- Ronan Lyons (House Price, Q3 2023)
- Ronan Lyons (Rental Price, Q2 2023)
- Ronan Lyons (House Price, Q2 2023)
- Ronan Lyons (Rental Price, Q1 2023)
- Ronan Lyons (House Price, Q1 2023)
- Ronan Lyons (Rental Price, Q4 2022)
- Ronan Lyons (House Price, Q4 2022)
- Ronan Lyons (Rental Price, Q3 2022)
- Ronan Lyons (House Price, Q3 2022)
- Ronan Lyons (Rental Price, Q2 2022)
- Ronan Lyons (House Price, Q2 2022)
- Ronan Lyons (Rental Price, Q1 2022)
- Ronan Lyons (House Price, Q1 2022)
- Ronan Lyons (Rental, Q4 2021)
- Ronan Lyons (House Price, Q4 2021)
- Ronan Lyons (Rental, Q3 2021)
- Ronan Lyons (House Price, Q3 2021)
- Ronan Lyons (Rental, Q2 2021)
- Ronan Lyons (House Price, Q2 2021)
- Ronan Lyons (Rental, Q1 2021)
- Ronan Lyons (House Price, Q1 2021)
- Ronan Lyons (Rental, Q4 2020)
- Ronan Lyons (House Price, Q4 2020)
- Ronan Lyons (Wealth, H2 2020)
- Ronan Lyons (Rental, Q3 2020)
- Ronan Lyons (House Price, Q3 2020)
- Ronan Lyons (Housing, July 2020)
- Ronan Lyons (Housing, June 2020)
- Ronan Lyons (Housing, May 2020)
- Ronan Lyons (Rental, Q1 2020)
- Ronan Lyons (House Price, Q1 2020)
- Ronan Lyons (Rental, Q4 2019)
- Ronan Lyons (House Price, Q4 2019)
- Ronan Lyons (Wealth, H2 2019)
- Ronan Lyons (Rental, Q3 2019)
- Ronan Lyons (House Price, Q3 2019)
- Pierre Yimbog (Rental, Q2 2019)
- Ronan Lyons (House Price, Q2 2019)
- Ronan Lyons (Wealth, H1 2019)
- Ronan Lyons (Rental, Q1 2019)
- Ronan Lyons (House Price, Q1 2019)
- Ronan Lyons (Rental, Q4 2018)
- Ronan Lyons (House Price, Q4 2018)
- Ronan Lyons (Wealth, H2 2018)
- Ronan Lyons (Rental, Q3 2018)
- Ronan Lyons (House Price, Q3 2018)
- Shane De Rís (Rental, Q2 2018)
- Ronan Lyons (House Price, Q2 2018)
- Ronan Lyons (Wealth, 2018)
- Ronan Lyons (Rental, Q1 2018)
- Ronan Lyons (House Price, Q1 2018)
- Ronan Lyons (Rental, Q4 2017)
- Ronan Lyons (House Price, Q4 2017)
- Ronan Lyons (Rental, Q3 2017)
- Ronan Lyons (House Price, Q3 2017)
- Katie Ascough (Rental, Q2 2017)
- Ronan Lyons (Wealth, 2017)
- Ronan Lyons (House Price, Q2 2017)
- Ronan Lyons (Rental, Q1 2017)
- Ronan Lyons (House Price, Q1 2017)
- Ronan Lyons (Rental, Q4 2016)
- Ronan Lyons (House Price, Q4 2016)
- Ronan Lyons (Rental, Q3 2016)
- Ronan Lyons (House Price, Q3 2016)
- Ronan Lyons (School Report, 2016)
- Conor Viscardi (Rental, Q2 2016)
- Ronan Lyons (Rail Report, 2016)
- Ronan Lyons (House Price, Q2 2016)
- Ronan Lyons (Rental, Q1 2016)
- Ronan Lyons (House Price, Q1 2016)
- Ronan Lyons (Rental, Q4 2015)
- Ronan Lyons (House Price, Q4 2015)
- Ronan Lyons (Rental, Q3 2015)
- Ronan Lyons (House Price, Q3 2015)
- Marcus O'Halloran (Rental, Q2 2015)
- Ronan Lyons (House Price, Q2 2015)
- Ronan Lyons (Rental, Q1 2015)
- Ronan Lyons (House Price, Q1 2015)
- Ronan Lyons (Rental, Q4 2014)
- Ronan Lyons (House Price, Q4 2014)
- Ronan Lyons (Rental, Q3 2014)
- Ronan Lyons (House Price, Q3 2014)
- Domhnall McGlacken-Byrne (Rental, Q2 2014)
- Ronan Lyons (House Price, Q2 2014)
- Ronan Lyons (Rental, Q1 2014)
- Ronan Lyons (House Price, Q1 2014)
- Ronan Lyons (Rental, Q4 2013)
- Ronan Lyons (House Price, Q4 2013)
- Ronan Lyons (Rental, Q3 2013)
- Ronan Lyons (House Price, Q3 2013)
- Ronan Lyons (Rental, Q2 2013)
- Ronan Lyons (House Price, Q2 2013)
- Ronan Lyons (Rental, Q1 2013)
- Ronan Lyons (House Price, Q1 2013)
- Ronan Lyons (Rental, Q4 2012)
- Ronan Lyons (House Price, Q4 2012)
- Lorcan Sirr (Rental, Q3 2012)
- Padraic Kenna (House Price, Q3 2012)
- John Logue (Rental, Q2 2012)
- Ronan Lyons (House Price, Q2 2012)
- Barry O'Leary (Rental, Q1 2012)
- Seamus Coffey (House Price, Q1 2012)
- Joan Burton (Rental, Q4 2011)
- Ronan Lyons (House Price, Q4 2011)
- Philip O'Sullivan (Rental, Q3 2011)
- Sheila O'Flanagan (House Price, Q3 2011)
- Rachel Breslin (Rental, Q2 2011)
- Constantin Gurdgiev (House Price, Q2 2011)
- Cormac Lucey (Rental, Q1 2011)
- Eoin Fahy (House Price, Q1 2011)
- Lorcan Roche Kelly (Rental, Q4 2010)
- Ronan Lyons (House Price, Q4 2010)
- John Fitzgerald (Rental, Q3 2010)
- Patrick Koucheravy (House Price, Q3 2010)
- Gary Redmond (Rental, Q2 2010)
- Jim Power (House Price, Q2 2010)
- Jill Kerby (Rental, Q1 2010)
- Brian Lucey (House Price, Q1 2010)
- Michael Taft (Rental, Q4 2009)
- Alan McQuaid (House Price, Q4 2009)
- Dr. Charles J. Larkin (Rental, Q3 2009)
- Emer O'Siochru (House Price, Q3 2009)
- Ronan Lyons (Rental, Q2 2009)
- Oliver Gilvarry (House Price, Q2 2009)
- Brian Devine (Rental, Q1 2009)
- Dr. Liam Delaney (House Price, Q1 2009)
- Gerard O'Neill (Rental, Q4 2008)
- Ronan Lyons (House Price, Q4 2008)
- Dr. Stephen Kinsella (Rental, Q3 2008)
- Moore McDowell (House Price, Q3 2008)
- Shane Kelly (Rental, Q2 2008)
- Fergal O'Brien (House Price, Q2 2008)
- Eoin O'Sullivan (Rental, Q1 2008)
- Dermot O'Leary (House Price, Q1 2008)
- Dan O'Brien (Rental, Q4 2007)
- Frances Ruane (House Price, Q4 2007)
- John McCartney (Rental, Q3 2007)
- Ronnie O'Toole (House Price, Q3 2007)
- Ronan Lyons (Rental, Q2 2007)
- Constantin Gurdgiev (House Price, Q2 2007)
- Fintan McNamara (Rental, Q1 2007)
- Rossa White (House Price, Q1 2007)
- Geoff Tucker (Rental, Q4 2006)
- Damien Kiberd (House Price, Q4 2006)
- Pat McArdle (House Price, Q3 2006)
- Marc Coleman (House Price, Q2 2006)
- David Duffy (House Price, Q1 2006)
- Austin Hughes (House Price, Q4 2005)
- David McWilliams (House Price, Q2 2005)

4th Jan 2023
As supply strengthens, demand cools
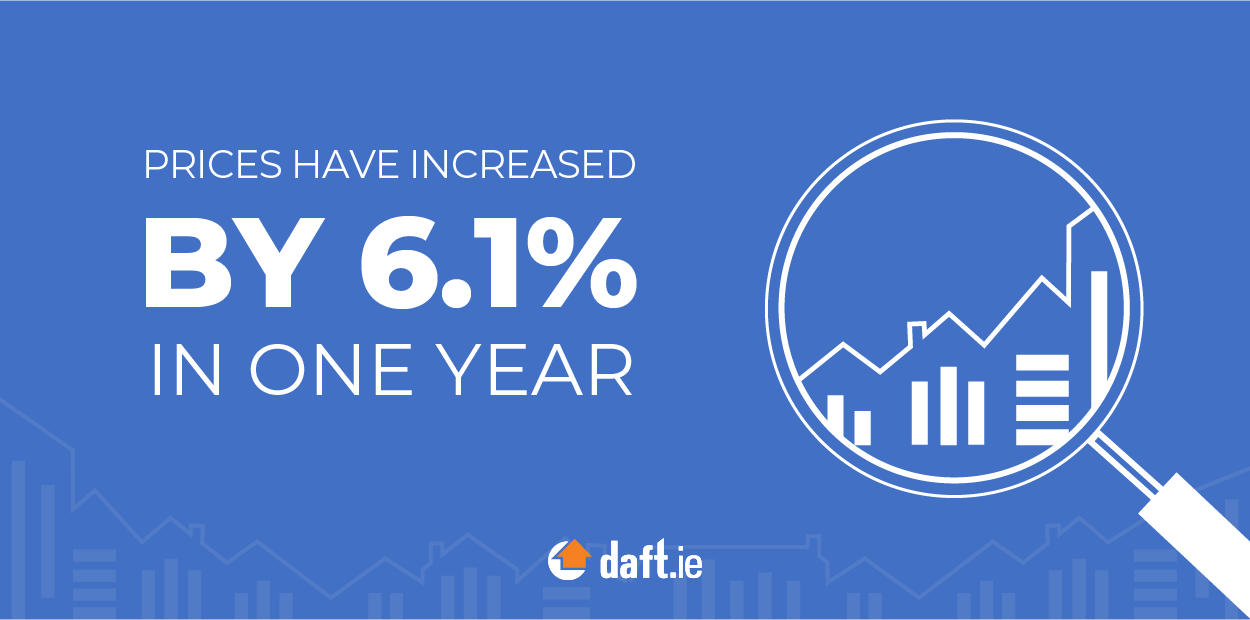
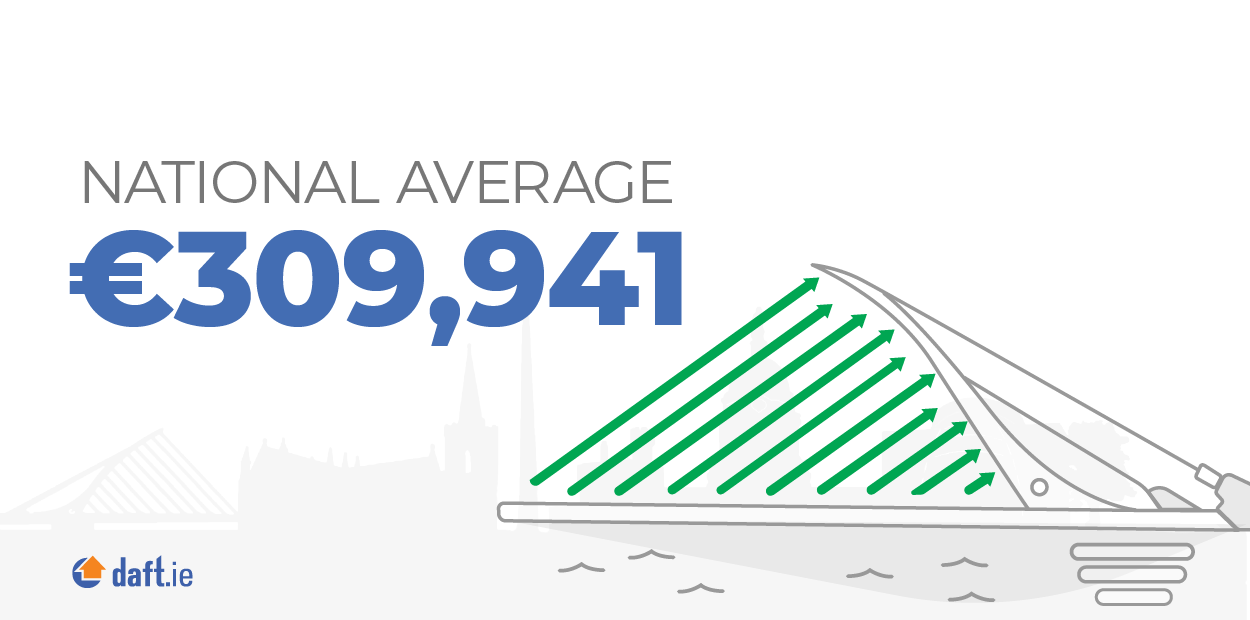
Over the course of 2022, the average listed price nationwide increased by 6.1%. This marks a smaller increase than during 2021 (8.1%) or 2020 (7.7%) ‐ but, given that the market pre-covid19 was effectively in balance, with a slight fall of 1.2% during 2019, the sales market in Ireland was not over the course of the last 12 months one where supply was adequate to meet demand.

This is what the headline indicator from this latest Daft.ie Report tells us. There are, of course, lots more details when one scratches the surface. One is the declining difference between Dublin and the rest of the country. 2022 was another year where prices outside Dublin (6.9%) saw a bigger increase than the capital (5.0%) ‐ although far less dramatically than in 2021, when prices outside Dublin rose by 11.2% compared to just 3.4% in the city.
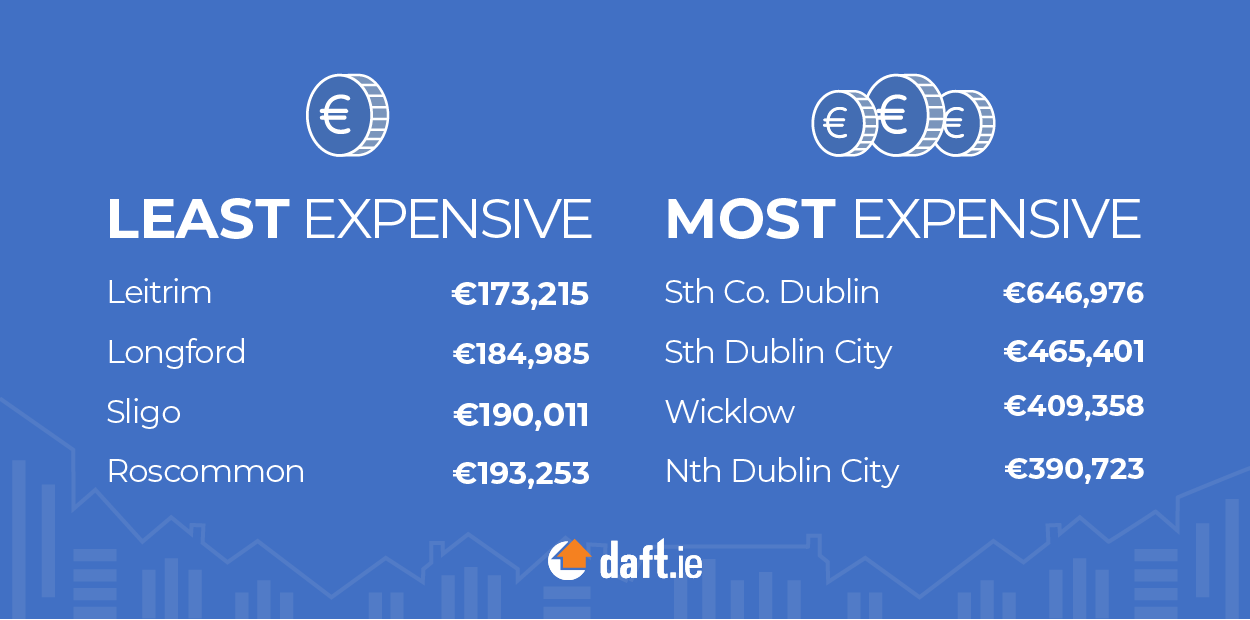
And this two-way split, of course, itself hides a lot of detail. Within Dublin, certain postcodes ‐ in particular Dublin 6 (around Rathmines and Ranelagh) and Dublin 15 (Castleknock) saw strong growth during the year, with prices rising 9.6% and 6.9% respectively in these postal districts. Meanwhile, prices fell by 5% in Dublin 17 (Clonshaugh and Priorswood) and grew by 3% or less in Dublin 10, Dublin 20 and Dublin 22. If this looks like a simple story of more expensive areas seeing greater price growth, then an increase of just 1.4% in Dublin 4 ‐ and 3.3% in South County Dublin ‐ over the course of the year is a significant complication in such a narrative.
Outside Dublin, in general increases were larger ‐ although Cork City and Monaghan (both 3.3%) saw very little price growth during the year. Most of Monaghan's neighbours, on the other hand, saw price growth of 9% or more ‐ as did much of Leinster.

Part of the reason there are such a multitude of stories is the pattern of change by quarter, rather than by year. Prices nationally showed strong rates of growth in both first and second quarters: 2.9% and 3.6% respectively, two of the three largest quarterly gains in the last five years. But in the third quarter, prices were effectively static and in the final quarter they declined by 0.4%.
During the 2010s, a pattern emerged of what the academic literature calls a 'cold' market in the final three months of the year. In each year from 2014 to 2018, encouraged by the calendar-year basis of the mortgage market rules and their exemptions, prices rose in each of the first three quarters but fell in the final one.
This seasonality was noticeably absent from the market between the middle of 2020 and the middle of 2022, when prices rose for eight consecutive quarters ‐ the longest run of increases going back to the start of the Daft.ie Sales Report in 2006.

What are we to take from two quarters in a row without an increase in prices? The last time this happened, in the second half of 2019, it could be interpreted ‐ as my commentary on that report did ‐ largely as a sign of supply, both new and second-hand, at long last coming up to the levels needed to meet market demand.
Over the course of 2019, almost 70,000 homes were listed for sale ‐ with just over one third of these (24,000 on average) on the market at any point in time that year. Covid19 caused havoc with the sales market and the number of homes advertised in the year to February 2021 was just 46,000. But even as supply faltered, demand remained strong ‐ boosted by unexpected savings during the pandemic. Prices surged and the total number of homes on the market halved to just 12,000 in early 2021.
Since then, supply has recovered ‐ slowly and steadily rather than rapidly ‐ with 64,000 homes put up for sale during 2022, a level of supply similar to 2018. Any loss of supply, though, takes time to be replaced and while the flow of properties onto the market has almost fully recovered, availability ‐ at just over 15,000 homes on December 1st ‐ remains closer to the pandemic low than the pre-pandemic level.
Coupled with another 6% increase in the average listed prices, this suggests that, at least over the course of 2022, demand has remained strong. But what will 2023 bring? There are reasons to think that demand has started to cool off, following an unprecedented couple of years.
On the one hand, interest rates have risen. One mortgage market provider started the year with fixed rates below 2% but will enter the new year with rates for the same product of almost double that. This mathematically filters through to affordability and the maximum loan a provider will lend.
Underpinning the change in mortgage market conditions, though, is of course a wider change in macroeconomic conditions, at least part of which is related to economies adjusting to a post-lockdown world and to the war in Ukraine. Such uncertainty makes people less confident about the future.
We can see this in the expected rate of change in housing prices. At 0.2% in December, this is the weakest expected increase since 2020, when lockdown meant that people expected ‐ initially at least ‐ that prices would fall. But in 2020, as discussed above, it was supply rather than demand that was most affected by lockdown.
As supply recovers and demand appears to be more uncertain, 2023 may bring the closest to a sales market in balance that Ireland has seen for some time.
