
Link between rising rents and new supply broken
Daft Reports
- Ronan Lyons (House Price, Q1 2024)
- Ronan Lyons (Rental Price, Q4 2023)
- Ronan Lyons (House Price, Q4 2023)
- Ronan Lyons (Rental Price, Q3 2023)
- Ronan Lyons (House Price, Q3 2023)
- Ronan Lyons (Rental Price, Q2 2023)
- Ronan Lyons (House Price, Q2 2023)
- Ronan Lyons (Rental Price, Q1 2023)
- Ronan Lyons (House Price, Q1 2023)
- Ronan Lyons (Rental Price, Q4 2022)
- Ronan Lyons (House Price, Q4 2022)
- Ronan Lyons (Rental Price, Q3 2022)
- Ronan Lyons (House Price, Q3 2022)
- Ronan Lyons (Rental Price, Q2 2022)
- Ronan Lyons (House Price, Q2 2022)
- Ronan Lyons (Rental Price, Q1 2022)
- Ronan Lyons (House Price, Q1 2022)
- Ronan Lyons (Rental, Q4 2021)
- Ronan Lyons (House Price, Q4 2021)
- Ronan Lyons (Rental, Q3 2021)
- Ronan Lyons (House Price, Q3 2021)
- Ronan Lyons (Rental, Q2 2021)
- Ronan Lyons (House Price, Q2 2021)
- Ronan Lyons (Rental, Q1 2021)
- Ronan Lyons (House Price, Q1 2021)
- Ronan Lyons (Rental, Q4 2020)
- Ronan Lyons (House Price, Q4 2020)
- Ronan Lyons (Wealth, H2 2020)
- Ronan Lyons (Rental, Q3 2020)
- Ronan Lyons (House Price, Q3 2020)
- Ronan Lyons (Housing, July 2020)
- Ronan Lyons (Housing, June 2020)
- Ronan Lyons (Housing, May 2020)
- Ronan Lyons (Rental, Q1 2020)
- Ronan Lyons (House Price, Q1 2020)
- Ronan Lyons (Rental, Q4 2019)
- Ronan Lyons (House Price, Q4 2019)
- Ronan Lyons (Wealth, H2 2019)
- Ronan Lyons (Rental, Q3 2019)
- Ronan Lyons (House Price, Q3 2019)
- Pierre Yimbog (Rental, Q2 2019)
- Ronan Lyons (House Price, Q2 2019)
- Ronan Lyons (Wealth, H1 2019)
- Ronan Lyons (Rental, Q1 2019)
- Ronan Lyons (House Price, Q1 2019)
- Ronan Lyons (Rental, Q4 2018)
- Ronan Lyons (House Price, Q4 2018)
- Ronan Lyons (Wealth, H2 2018)
- Ronan Lyons (Rental, Q3 2018)
- Ronan Lyons (House Price, Q3 2018)
- Shane De Rís (Rental, Q2 2018)
- Ronan Lyons (House Price, Q2 2018)
- Ronan Lyons (Wealth, 2018)
- Ronan Lyons (Rental, Q1 2018)
- Ronan Lyons (House Price, Q1 2018)
- Ronan Lyons (Rental, Q4 2017)
- Ronan Lyons (House Price, Q4 2017)
- Ronan Lyons (Rental, Q3 2017)
- Ronan Lyons (House Price, Q3 2017)
- Katie Ascough (Rental, Q2 2017)
- Ronan Lyons (Wealth, 2017)
- Ronan Lyons (House Price, Q2 2017)
- Ronan Lyons (Rental, Q1 2017)
- Ronan Lyons (House Price, Q1 2017)
- Ronan Lyons (Rental, Q4 2016)
- Ronan Lyons (House Price, Q4 2016)
- Ronan Lyons (Rental, Q3 2016)
- Ronan Lyons (House Price, Q3 2016)
- Ronan Lyons (School Report, 2016)
- Conor Viscardi (Rental, Q2 2016)
- Ronan Lyons (Rail Report, 2016)
- Ronan Lyons (House Price, Q2 2016)
- Ronan Lyons (Rental, Q1 2016)
- Ronan Lyons (House Price, Q1 2016)
- Ronan Lyons (Rental, Q4 2015)
- Ronan Lyons (House Price, Q4 2015)
- Ronan Lyons (Rental, Q3 2015)
- Ronan Lyons (House Price, Q3 2015)
- Marcus O'Halloran (Rental, Q2 2015)
- Ronan Lyons (House Price, Q2 2015)
- Ronan Lyons (Rental, Q1 2015)
- Ronan Lyons (House Price, Q1 2015)
- Ronan Lyons (Rental, Q4 2014)
- Ronan Lyons (House Price, Q4 2014)
- Ronan Lyons (Rental, Q3 2014)
- Ronan Lyons (House Price, Q3 2014)
- Domhnall McGlacken-Byrne (Rental, Q2 2014)
- Ronan Lyons (House Price, Q2 2014)
- Ronan Lyons (Rental, Q1 2014)
- Ronan Lyons (House Price, Q1 2014)
- Ronan Lyons (Rental, Q4 2013)
- Ronan Lyons (House Price, Q4 2013)
- Ronan Lyons (Rental, Q3 2013)
- Ronan Lyons (House Price, Q3 2013)
- Ronan Lyons (Rental, Q2 2013)
- Ronan Lyons (House Price, Q2 2013)
- Ronan Lyons (Rental, Q1 2013)
- Ronan Lyons (House Price, Q1 2013)
- Ronan Lyons (Rental, Q4 2012)
- Ronan Lyons (House Price, Q4 2012)
- Lorcan Sirr (Rental, Q3 2012)
- Padraic Kenna (House Price, Q3 2012)
- John Logue (Rental, Q2 2012)
- Ronan Lyons (House Price, Q2 2012)
- Barry O'Leary (Rental, Q1 2012)
- Seamus Coffey (House Price, Q1 2012)
- Joan Burton (Rental, Q4 2011)
- Ronan Lyons (House Price, Q4 2011)
- Philip O'Sullivan (Rental, Q3 2011)
- Sheila O'Flanagan (House Price, Q3 2011)
- Rachel Breslin (Rental, Q2 2011)
- Constantin Gurdgiev (House Price, Q2 2011)
- Cormac Lucey (Rental, Q1 2011)
- Eoin Fahy (House Price, Q1 2011)
- Lorcan Roche Kelly (Rental, Q4 2010)
- Ronan Lyons (House Price, Q4 2010)
- John Fitzgerald (Rental, Q3 2010)
- Patrick Koucheravy (House Price, Q3 2010)
- Gary Redmond (Rental, Q2 2010)
- Jim Power (House Price, Q2 2010)
- Jill Kerby (Rental, Q1 2010)
- Brian Lucey (House Price, Q1 2010)
- Michael Taft (Rental, Q4 2009)
- Alan McQuaid (House Price, Q4 2009)
- Dr. Charles J. Larkin (Rental, Q3 2009)
- Emer O'Siochru (House Price, Q3 2009)
- Ronan Lyons (Rental, Q2 2009)
- Oliver Gilvarry (House Price, Q2 2009)
- Brian Devine (Rental, Q1 2009)
- Dr. Liam Delaney (House Price, Q1 2009)
- Gerard O'Neill (Rental, Q4 2008)
- Ronan Lyons (House Price, Q4 2008)
- Dr. Stephen Kinsella (Rental, Q3 2008)
- Moore McDowell (House Price, Q3 2008)
- Shane Kelly (Rental, Q2 2008)
- Fergal O'Brien (House Price, Q2 2008)
- Eoin O'Sullivan (Rental, Q1 2008)
- Dermot O'Leary (House Price, Q1 2008)
- Dan O'Brien (Rental, Q4 2007)
- Frances Ruane (House Price, Q4 2007)
- John McCartney (Rental, Q3 2007)
- Ronnie O'Toole (House Price, Q3 2007)
- Ronan Lyons (Rental, Q2 2007)
- Constantin Gurdgiev (House Price, Q2 2007)
- Fintan McNamara (Rental, Q1 2007)
- Rossa White (House Price, Q1 2007)
- Geoff Tucker (Rental, Q4 2006)
- Damien Kiberd (House Price, Q4 2006)
- Pat McArdle (House Price, Q3 2006)
- Marc Coleman (House Price, Q2 2006)
- David Duffy (House Price, Q1 2006)
- Austin Hughes (House Price, Q4 2005)
- David McWilliams (House Price, Q2 2005)

17th Nov 2014
Ronan Lyons, Daft's in-house economist, commenting on the latest Daft research on the Irish property market.
Link between rising rents and new supply broken
Rents continued to rise throughout the country between August and October, according to the figures published in this report. Over the last two years, the average rent nationwide has risen by almost €150, from €790 a month to €933. As has been documented in previous issues of this report, that national trend is being driven by Dublin, where rents are up an average of €300 a month since 2012.
But the latest figures show that rental inflation outside the cities is above what might be considered a healthy rate, in line with the rest of the economy. While prices in the rest of the economy were roughly flat in the year to October, rent inflation stayed above 10%. A small easing in Dublin inflation - from 15.6% to 14.5% - was offset by an increase in ex-Dublin inflation, from 5.7% to 6.6%.
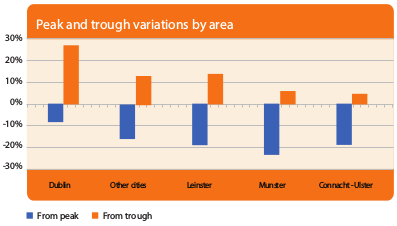
Where are rents now compared both to their lowest point in 2012-2013 and to their highest point in 2007? The first graph below shows how rents now compare to those achieved at the peak and at the recent trough. What is clear is that, while there has been some uptick in non-city rents, particularly in Leinster, average monthly rents remain well below their 2007 levels, typically by about 20%.
Of greater concern is what has happened in Dublin. In the capital, rents are now almost 30% above their lowest point in 2012 and less than 10% below their 2007 peaks. This is very damaging for Dublin's competitiveness as a location for foreign direct investment. The goal of housing policy should be to ensure that, regardless of whether it's to rent or to buy, rural or urban, housing is abundant and affordable.
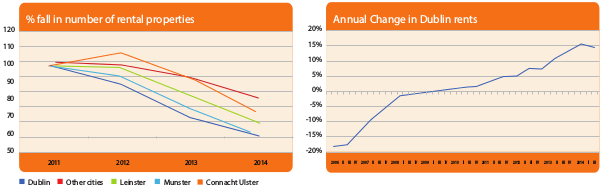
In many ways, the lack of choice is more concerning than the high rental rates, although clearly the two phenomena are inextricably linked. The second graph shows how many properties were listed to rent in the first nine months of each year, from 2011 to 2014, with 2011 set as the base. The number of properties listed to rent in Dublin has fallen from over 47,000 in the first nine months of 2011 to less than 27,000 in the same period this year.
Unlike the sales market, then, where rapidly rising prices have drawn out significant amounts of second-hand From peak rising From trough have not seen any increase in listings. If anything, the opposite is the case. And the picture supply, rents is even worse for building new homes.
This is particularly worrying given Dublin's population is growing by roughly 10,000 households a year. Dublin City Council recently confirmed that fewer than 500 units are under construction at the moment in land under their control. While building in the capital will of course be spread between the four local authorities, the Dublin City Council area is by far the most important. Also, given renters' preference for central location, the squeeze on construction affects them most.
The only silver lining is the fact that this quarter was the first time in five years that rent inflation in the capital eased somewhat. As shown in the third and final graph below, from mid-2009, when rents were falling by 18% a year, each successive quarter has seen an increase in rental inflation until now. We should not make too much of this - one swallow does not make a summer - but hopefully an easing in Dublin rental inflation can continue.
That would at least stop the affordability crisis from worsening. It does nothing, however, to change the availability crisis. For that - as I've outlined in recent report commentaries - we need Government policy to change and change fast.
HIGHLIGHTS: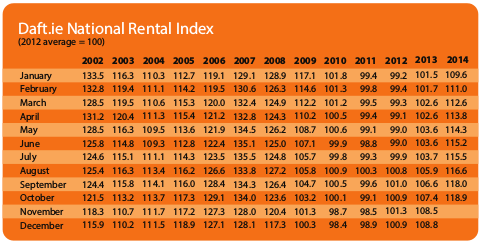
Rental Price Index
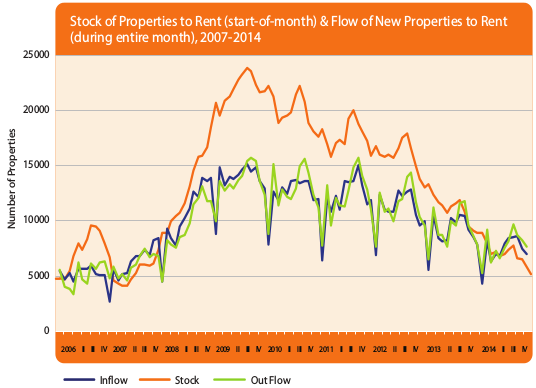
Stock and Flow of Rental Properties
SNAPSHOT:
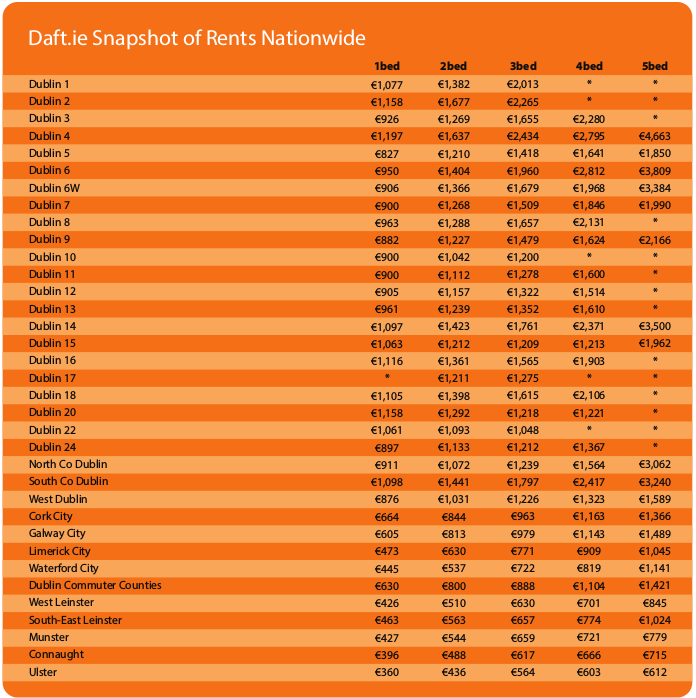
Snapshot of Rental Prices Nationwide