What the geography of house price rises tells us
Daft Reports
- Ronan Lyons (House Price, Q1 2024)
- Ronan Lyons (Rental Price, Q4 2023)
- Ronan Lyons (House Price, Q4 2023)
- Ronan Lyons (Rental Price, Q3 2023)
- Ronan Lyons (House Price, Q3 2023)
- Ronan Lyons (Rental Price, Q2 2023)
- Ronan Lyons (House Price, Q2 2023)
- Ronan Lyons (Rental Price, Q1 2023)
- Ronan Lyons (House Price, Q1 2023)
- Ronan Lyons (Rental Price, Q4 2022)
- Ronan Lyons (House Price, Q4 2022)
- Ronan Lyons (Rental Price, Q3 2022)
- Ronan Lyons (House Price, Q3 2022)
- Ronan Lyons (Rental Price, Q2 2022)
- Ronan Lyons (House Price, Q2 2022)
- Ronan Lyons (Rental Price, Q1 2022)
- Ronan Lyons (House Price, Q1 2022)
- Ronan Lyons (Rental, Q4 2021)
- Ronan Lyons (House Price, Q4 2021)
- Ronan Lyons (Rental, Q3 2021)
- Ronan Lyons (House Price, Q3 2021)
- Ronan Lyons (Rental, Q2 2021)
- Ronan Lyons (House Price, Q2 2021)
- Ronan Lyons (Rental, Q1 2021)
- Ronan Lyons (House Price, Q1 2021)
- Ronan Lyons (Rental, Q4 2020)
- Ronan Lyons (House Price, Q4 2020)
- Ronan Lyons (Wealth, H2 2020)
- Ronan Lyons (Rental, Q3 2020)
- Ronan Lyons (House Price, Q3 2020)
- Ronan Lyons (Housing, July 2020)
- Ronan Lyons (Housing, June 2020)
- Ronan Lyons (Housing, May 2020)
- Ronan Lyons (Rental, Q1 2020)
- Ronan Lyons (House Price, Q1 2020)
- Ronan Lyons (Rental, Q4 2019)
- Ronan Lyons (House Price, Q4 2019)
- Ronan Lyons (Wealth, H2 2019)
- Ronan Lyons (Rental, Q3 2019)
- Ronan Lyons (House Price, Q3 2019)
- Pierre Yimbog (Rental, Q2 2019)
- Ronan Lyons (House Price, Q2 2019)
- Ronan Lyons (Wealth, H1 2019)
- Ronan Lyons (Rental, Q1 2019)
- Ronan Lyons (House Price, Q1 2019)
- Ronan Lyons (Rental, Q4 2018)
- Ronan Lyons (House Price, Q4 2018)
- Ronan Lyons (Wealth, H2 2018)
- Ronan Lyons (Rental, Q3 2018)
- Ronan Lyons (House Price, Q3 2018)
- Shane De Rís (Rental, Q2 2018)
- Ronan Lyons (House Price, Q2 2018)
- Ronan Lyons (Wealth, 2018)
- Ronan Lyons (Rental, Q1 2018)
- Ronan Lyons (House Price, Q1 2018)
- Ronan Lyons (Rental, Q4 2017)
- Ronan Lyons (House Price, Q4 2017)
- Ronan Lyons (Rental, Q3 2017)
- Ronan Lyons (House Price, Q3 2017)
- Katie Ascough (Rental, Q2 2017)
- Ronan Lyons (Wealth, 2017)
- Ronan Lyons (House Price, Q2 2017)
- Ronan Lyons (Rental, Q1 2017)
- Ronan Lyons (House Price, Q1 2017)
- Ronan Lyons (Rental, Q4 2016)
- Ronan Lyons (House Price, Q4 2016)
- Ronan Lyons (Rental, Q3 2016)
- Ronan Lyons (House Price, Q3 2016)
- Ronan Lyons (School Report, 2016)
- Conor Viscardi (Rental, Q2 2016)
- Ronan Lyons (Rail Report, 2016)
- Ronan Lyons (House Price, Q2 2016)
- Ronan Lyons (Rental, Q1 2016)
- Ronan Lyons (House Price, Q1 2016)
- Ronan Lyons (Rental, Q4 2015)
- Ronan Lyons (House Price, Q4 2015)
- Ronan Lyons (Rental, Q3 2015)
- Ronan Lyons (House Price, Q3 2015)
- Marcus O'Halloran (Rental, Q2 2015)
- Ronan Lyons (House Price, Q2 2015)
- Ronan Lyons (Rental, Q1 2015)
- Ronan Lyons (House Price, Q1 2015)
- Ronan Lyons (Rental, Q4 2014)
- Ronan Lyons (House Price, Q4 2014)
- Ronan Lyons (Rental, Q3 2014)
- Ronan Lyons (House Price, Q3 2014)
- Domhnall McGlacken-Byrne (Rental, Q2 2014)
- Ronan Lyons (House Price, Q2 2014)
- Ronan Lyons (Rental, Q1 2014)
- Ronan Lyons (House Price, Q1 2014)
- Ronan Lyons (Rental, Q4 2013)
- Ronan Lyons (House Price, Q4 2013)
- Ronan Lyons (Rental, Q3 2013)
- Ronan Lyons (House Price, Q3 2013)
- Ronan Lyons (Rental, Q2 2013)
- Ronan Lyons (House Price, Q2 2013)
- Ronan Lyons (Rental, Q1 2013)
- Ronan Lyons (House Price, Q1 2013)
- Ronan Lyons (Rental, Q4 2012)
- Ronan Lyons (House Price, Q4 2012)
- Lorcan Sirr (Rental, Q3 2012)
- Padraic Kenna (House Price, Q3 2012)
- John Logue (Rental, Q2 2012)
- Ronan Lyons (House Price, Q2 2012)
- Barry O'Leary (Rental, Q1 2012)
- Seamus Coffey (House Price, Q1 2012)
- Joan Burton (Rental, Q4 2011)
- Ronan Lyons (House Price, Q4 2011)
- Philip O'Sullivan (Rental, Q3 2011)
- Sheila O'Flanagan (House Price, Q3 2011)
- Rachel Breslin (Rental, Q2 2011)
- Constantin Gurdgiev (House Price, Q2 2011)
- Cormac Lucey (Rental, Q1 2011)
- Eoin Fahy (House Price, Q1 2011)
- Lorcan Roche Kelly (Rental, Q4 2010)
- Ronan Lyons (House Price, Q4 2010)
- John Fitzgerald (Rental, Q3 2010)
- Patrick Koucheravy (House Price, Q3 2010)
- Gary Redmond (Rental, Q2 2010)
- Jim Power (House Price, Q2 2010)
- Jill Kerby (Rental, Q1 2010)
- Brian Lucey (House Price, Q1 2010)
- Michael Taft (Rental, Q4 2009)
- Alan McQuaid (House Price, Q4 2009)
- Dr. Charles J. Larkin (Rental, Q3 2009)
- Emer O'Siochru (House Price, Q3 2009)
- Ronan Lyons (Rental, Q2 2009)
- Oliver Gilvarry (House Price, Q2 2009)
- Brian Devine (Rental, Q1 2009)
- Dr. Liam Delaney (House Price, Q1 2009)
- Gerard O'Neill (Rental, Q4 2008)
- Ronan Lyons (House Price, Q4 2008)
- Dr. Stephen Kinsella (Rental, Q3 2008)
- Moore McDowell (House Price, Q3 2008)
- Shane Kelly (Rental, Q2 2008)
- Fergal O'Brien (House Price, Q2 2008)
- Eoin O'Sullivan (Rental, Q1 2008)
- Dermot O'Leary (House Price, Q1 2008)
- Dan O'Brien (Rental, Q4 2007)
- Frances Ruane (House Price, Q4 2007)
- John McCartney (Rental, Q3 2007)
- Ronnie O'Toole (House Price, Q3 2007)
- Ronan Lyons (Rental, Q2 2007)
- Constantin Gurdgiev (House Price, Q2 2007)
- Fintan McNamara (Rental, Q1 2007)
- Rossa White (House Price, Q1 2007)
- Geoff Tucker (Rental, Q4 2006)
- Damien Kiberd (House Price, Q4 2006)
- Pat McArdle (House Price, Q3 2006)
- Marc Coleman (House Price, Q2 2006)
- David Duffy (House Price, Q1 2006)
- Austin Hughes (House Price, Q4 2005)
- David McWilliams (House Price, Q2 2005)

7th Apr 2015
Ronan Lyons, Daft's in-house economist, commenting on the latest Daft research on the Irish property market.
What the geography of house price rises tells us
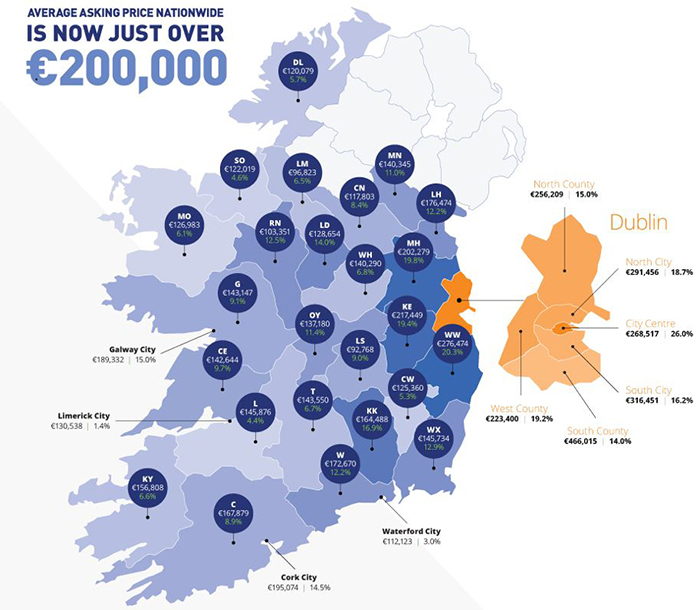
Having trumped expectations by falling across the country in late 2014, asking prices again sprung a surprise by rising strongly in the first three months of 2015. This was not a blip either, with prices rising strongly in all 35 regional markets analysed in the Daft.ie Report. The rise of 4.6% nationally more than offset the 1% fall in the final quarter of 2014 and is in line with the types of increase seen earlier in 2014 (which averaged 4.5%). A similar picture emerged from an analysis of Property Price Register transactions, with prices rising.
Can we assume, then, that the final three months of 2014 were an aberration and that the market has bounced back to “business as usual” with double-digit increases in prices in store for 2015? There are three reasons to think that this is not the case. Firstly, there may be some element of a “sigh of relief” as the Central Bank chose not to require a 20% deposit of first-time buyers, particularly in lower-price areas. This was the expectation in November but is now no longer the case and should be reflected in a one-off increase in average prices, rather than back to “business as usual”. With the new mortgage rules, house prices in the aggregate can in the future only grow as fast as incomes are growing, thus it is incredibly unlikely Dublin in particular will see a return to double-digit price increases.
Secondly, the fact that mortgage caps have indeed come in, albeit somewhat differently than expected, means that those with mortgage approval from before the regulations have a strong incentive to purchase before their approval runs out. This means that the first half of 2015 will contain some element of a rush in “old demand”. As it happens, this rush may be unnecessary, as the Central Bank’s relaxation of its minimum deposit requirements means that lending will be largely fixed in the pattern seen in 2014, in terms of the deposit and income multiples sought by banks across their loan-books as a whole.
Lastly, the housing market that has emerged since the start of 2015 is very different to the one that existed before September last year, when the Central Bank rules were first mooted. To see how, compare price growth in Dublin versus those outside the capital. The first quarter of 2015 was the first time in a long time that ex-Dublin prices rose by more than those in the capital. The contrast is stark also, with ex-Dublin prices seeing twice the increase (6% vs. 3%).
It could be argued that this would have happened anyway, as the price increases seen in Dublin since 2012 belatedly spread to other parts of the country. However, its rapidity and severity – Munster saw its largest three-month increase since early 2007 – plus the fact that increases were larger in Meath and Kildare than in other Leinster counties suggests something else. Compared to incomes, house prices are much higher in Dublin than elsewhere. This suggests that simple nationwide loan-to-income caps will shift demand from Dublin to the rest of the country.
Another way of measuring conditions in the housing market is to examine the difference between the asking price of a property and its ultimate transaction price. Particularly given Ireland’s unique lack of a postcode system, this requires a bit of effort to compile valid matches across the archive of online ads and the Property Price Register records. Nonetheless, it has been possible to build a sample of over 16,000 homes matched across listings and transaction archives since 2010 – with a roughly 50-50 split between Dublin and elsewhere. The average gap, for both Dublin and the rest of the country, is shown in the graph below, from the start of 2010 to the first quarter of 2015.
What it shows is not the gap at any given point in time between the listed price online and transaction prices, which are very highly correlated, but rather how the final transaction price compared with the initial asking price. This is a price that may have been set a number of months beforehand.
What the figure does show is that market conditions certainly turned between 2012 and 2014 in Dublin. In mid-2012, a transaction being concluded at that point in time had a price 10% lower than the initial advertised price. By mid-2014, the transaction price was 7% above the list price. In late 2014 and early 2015, however, that gap has halved. In the rest of the country, transaction prices now are only beginning to creep above the listed price.
Adding to our armoury of housing market metrics like this will help policymakers, analysts and academics as they monitor the health of our housing market. With credit largely under control, the focus now has to be on addressing the social housing system and the cost of building a home.