Irish House Price Report Q4 2021 | Daft.ie
Daft Reports
- Ronan Lyons (House Price, Q1 2024)
- Ronan Lyons (Rental Price, Q4 2023)
- Ronan Lyons (House Price, Q4 2023)
- Ronan Lyons (Rental Price, Q3 2023)
- Ronan Lyons (House Price, Q3 2023)
- Ronan Lyons (Rental Price, Q2 2023)
- Ronan Lyons (House Price, Q2 2023)
- Ronan Lyons (Rental Price, Q1 2023)
- Ronan Lyons (House Price, Q1 2023)
- Ronan Lyons (Rental Price, Q4 2022)
- Ronan Lyons (House Price, Q4 2022)
- Ronan Lyons (Rental Price, Q3 2022)
- Ronan Lyons (House Price, Q3 2022)
- Ronan Lyons (Rental Price, Q2 2022)
- Ronan Lyons (House Price, Q2 2022)
- Ronan Lyons (Rental Price, Q1 2022)
- Ronan Lyons (House Price, Q1 2022)
- Ronan Lyons (Rental, Q4 2021)
- Ronan Lyons (House Price, Q4 2021)
- Ronan Lyons (Rental, Q3 2021)
- Ronan Lyons (House Price, Q3 2021)
- Ronan Lyons (Rental, Q2 2021)
- Ronan Lyons (House Price, Q2 2021)
- Ronan Lyons (Rental, Q1 2021)
- Ronan Lyons (House Price, Q1 2021)
- Ronan Lyons (Rental, Q4 2020)
- Ronan Lyons (House Price, Q4 2020)
- Ronan Lyons (Wealth, H2 2020)
- Ronan Lyons (Rental, Q3 2020)
- Ronan Lyons (House Price, Q3 2020)
- Ronan Lyons (Housing, July 2020)
- Ronan Lyons (Housing, June 2020)
- Ronan Lyons (Housing, May 2020)
- Ronan Lyons (Rental, Q1 2020)
- Ronan Lyons (House Price, Q1 2020)
- Ronan Lyons (Rental, Q4 2019)
- Ronan Lyons (House Price, Q4 2019)
- Ronan Lyons (Wealth, H2 2019)
- Ronan Lyons (Rental, Q3 2019)
- Ronan Lyons (House Price, Q3 2019)
- Pierre Yimbog (Rental, Q2 2019)
- Ronan Lyons (House Price, Q2 2019)
- Ronan Lyons (Wealth, H1 2019)
- Ronan Lyons (Rental, Q1 2019)
- Ronan Lyons (House Price, Q1 2019)
- Ronan Lyons (Rental, Q4 2018)
- Ronan Lyons (House Price, Q4 2018)
- Ronan Lyons (Wealth, H2 2018)
- Ronan Lyons (Rental, Q3 2018)
- Ronan Lyons (House Price, Q3 2018)
- Shane De Rís (Rental, Q2 2018)
- Ronan Lyons (House Price, Q2 2018)
- Ronan Lyons (Wealth, 2018)
- Ronan Lyons (Rental, Q1 2018)
- Ronan Lyons (House Price, Q1 2018)
- Ronan Lyons (Rental, Q4 2017)
- Ronan Lyons (House Price, Q4 2017)
- Ronan Lyons (Rental, Q3 2017)
- Ronan Lyons (House Price, Q3 2017)
- Katie Ascough (Rental, Q2 2017)
- Ronan Lyons (Wealth, 2017)
- Ronan Lyons (House Price, Q2 2017)
- Ronan Lyons (Rental, Q1 2017)
- Ronan Lyons (House Price, Q1 2017)
- Ronan Lyons (Rental, Q4 2016)
- Ronan Lyons (House Price, Q4 2016)
- Ronan Lyons (Rental, Q3 2016)
- Ronan Lyons (House Price, Q3 2016)
- Ronan Lyons (School Report, 2016)
- Conor Viscardi (Rental, Q2 2016)
- Ronan Lyons (Rail Report, 2016)
- Ronan Lyons (House Price, Q2 2016)
- Ronan Lyons (Rental, Q1 2016)
- Ronan Lyons (House Price, Q1 2016)
- Ronan Lyons (Rental, Q4 2015)
- Ronan Lyons (House Price, Q4 2015)
- Ronan Lyons (Rental, Q3 2015)
- Ronan Lyons (House Price, Q3 2015)
- Marcus O'Halloran (Rental, Q2 2015)
- Ronan Lyons (House Price, Q2 2015)
- Ronan Lyons (Rental, Q1 2015)
- Ronan Lyons (House Price, Q1 2015)
- Ronan Lyons (Rental, Q4 2014)
- Ronan Lyons (House Price, Q4 2014)
- Ronan Lyons (Rental, Q3 2014)
- Ronan Lyons (House Price, Q3 2014)
- Domhnall McGlacken-Byrne (Rental, Q2 2014)
- Ronan Lyons (House Price, Q2 2014)
- Ronan Lyons (Rental, Q1 2014)
- Ronan Lyons (House Price, Q1 2014)
- Ronan Lyons (Rental, Q4 2013)
- Ronan Lyons (House Price, Q4 2013)
- Ronan Lyons (Rental, Q3 2013)
- Ronan Lyons (House Price, Q3 2013)
- Ronan Lyons (Rental, Q2 2013)
- Ronan Lyons (House Price, Q2 2013)
- Ronan Lyons (Rental, Q1 2013)
- Ronan Lyons (House Price, Q1 2013)
- Ronan Lyons (Rental, Q4 2012)
- Ronan Lyons (House Price, Q4 2012)
- Lorcan Sirr (Rental, Q3 2012)
- Padraic Kenna (House Price, Q3 2012)
- John Logue (Rental, Q2 2012)
- Ronan Lyons (House Price, Q2 2012)
- Barry O'Leary (Rental, Q1 2012)
- Seamus Coffey (House Price, Q1 2012)
- Joan Burton (Rental, Q4 2011)
- Ronan Lyons (House Price, Q4 2011)
- Philip O'Sullivan (Rental, Q3 2011)
- Sheila O'Flanagan (House Price, Q3 2011)
- Rachel Breslin (Rental, Q2 2011)
- Constantin Gurdgiev (House Price, Q2 2011)
- Cormac Lucey (Rental, Q1 2011)
- Eoin Fahy (House Price, Q1 2011)
- Lorcan Roche Kelly (Rental, Q4 2010)
- Ronan Lyons (House Price, Q4 2010)
- John Fitzgerald (Rental, Q3 2010)
- Patrick Koucheravy (House Price, Q3 2010)
- Gary Redmond (Rental, Q2 2010)
- Jim Power (House Price, Q2 2010)
- Jill Kerby (Rental, Q1 2010)
- Brian Lucey (House Price, Q1 2010)
- Michael Taft (Rental, Q4 2009)
- Alan McQuaid (House Price, Q4 2009)
- Dr. Charles J. Larkin (Rental, Q3 2009)
- Emer O'Siochru (House Price, Q3 2009)
- Ronan Lyons (Rental, Q2 2009)
- Oliver Gilvarry (House Price, Q2 2009)
- Brian Devine (Rental, Q1 2009)
- Dr. Liam Delaney (House Price, Q1 2009)
- Gerard O'Neill (Rental, Q4 2008)
- Ronan Lyons (House Price, Q4 2008)
- Dr. Stephen Kinsella (Rental, Q3 2008)
- Moore McDowell (House Price, Q3 2008)
- Shane Kelly (Rental, Q2 2008)
- Fergal O'Brien (House Price, Q2 2008)
- Eoin O'Sullivan (Rental, Q1 2008)
- Dermot O'Leary (House Price, Q1 2008)
- Dan O'Brien (Rental, Q4 2007)
- Frances Ruane (House Price, Q4 2007)
- John McCartney (Rental, Q3 2007)
- Ronnie O'Toole (House Price, Q3 2007)
- Ronan Lyons (Rental, Q2 2007)
- Constantin Gurdgiev (House Price, Q2 2007)
- Fintan McNamara (Rental, Q1 2007)
- Rossa White (House Price, Q1 2007)
- Geoff Tucker (Rental, Q4 2006)
- Damien Kiberd (House Price, Q4 2006)
- Pat McArdle (House Price, Q3 2006)
- Marc Coleman (House Price, Q2 2006)
- David Duffy (House Price, Q1 2006)
- Austin Hughes (House Price, Q4 2005)
- David McWilliams (House Price, Q2 2005)

29th Dec 2021
Nothing but the same old story?
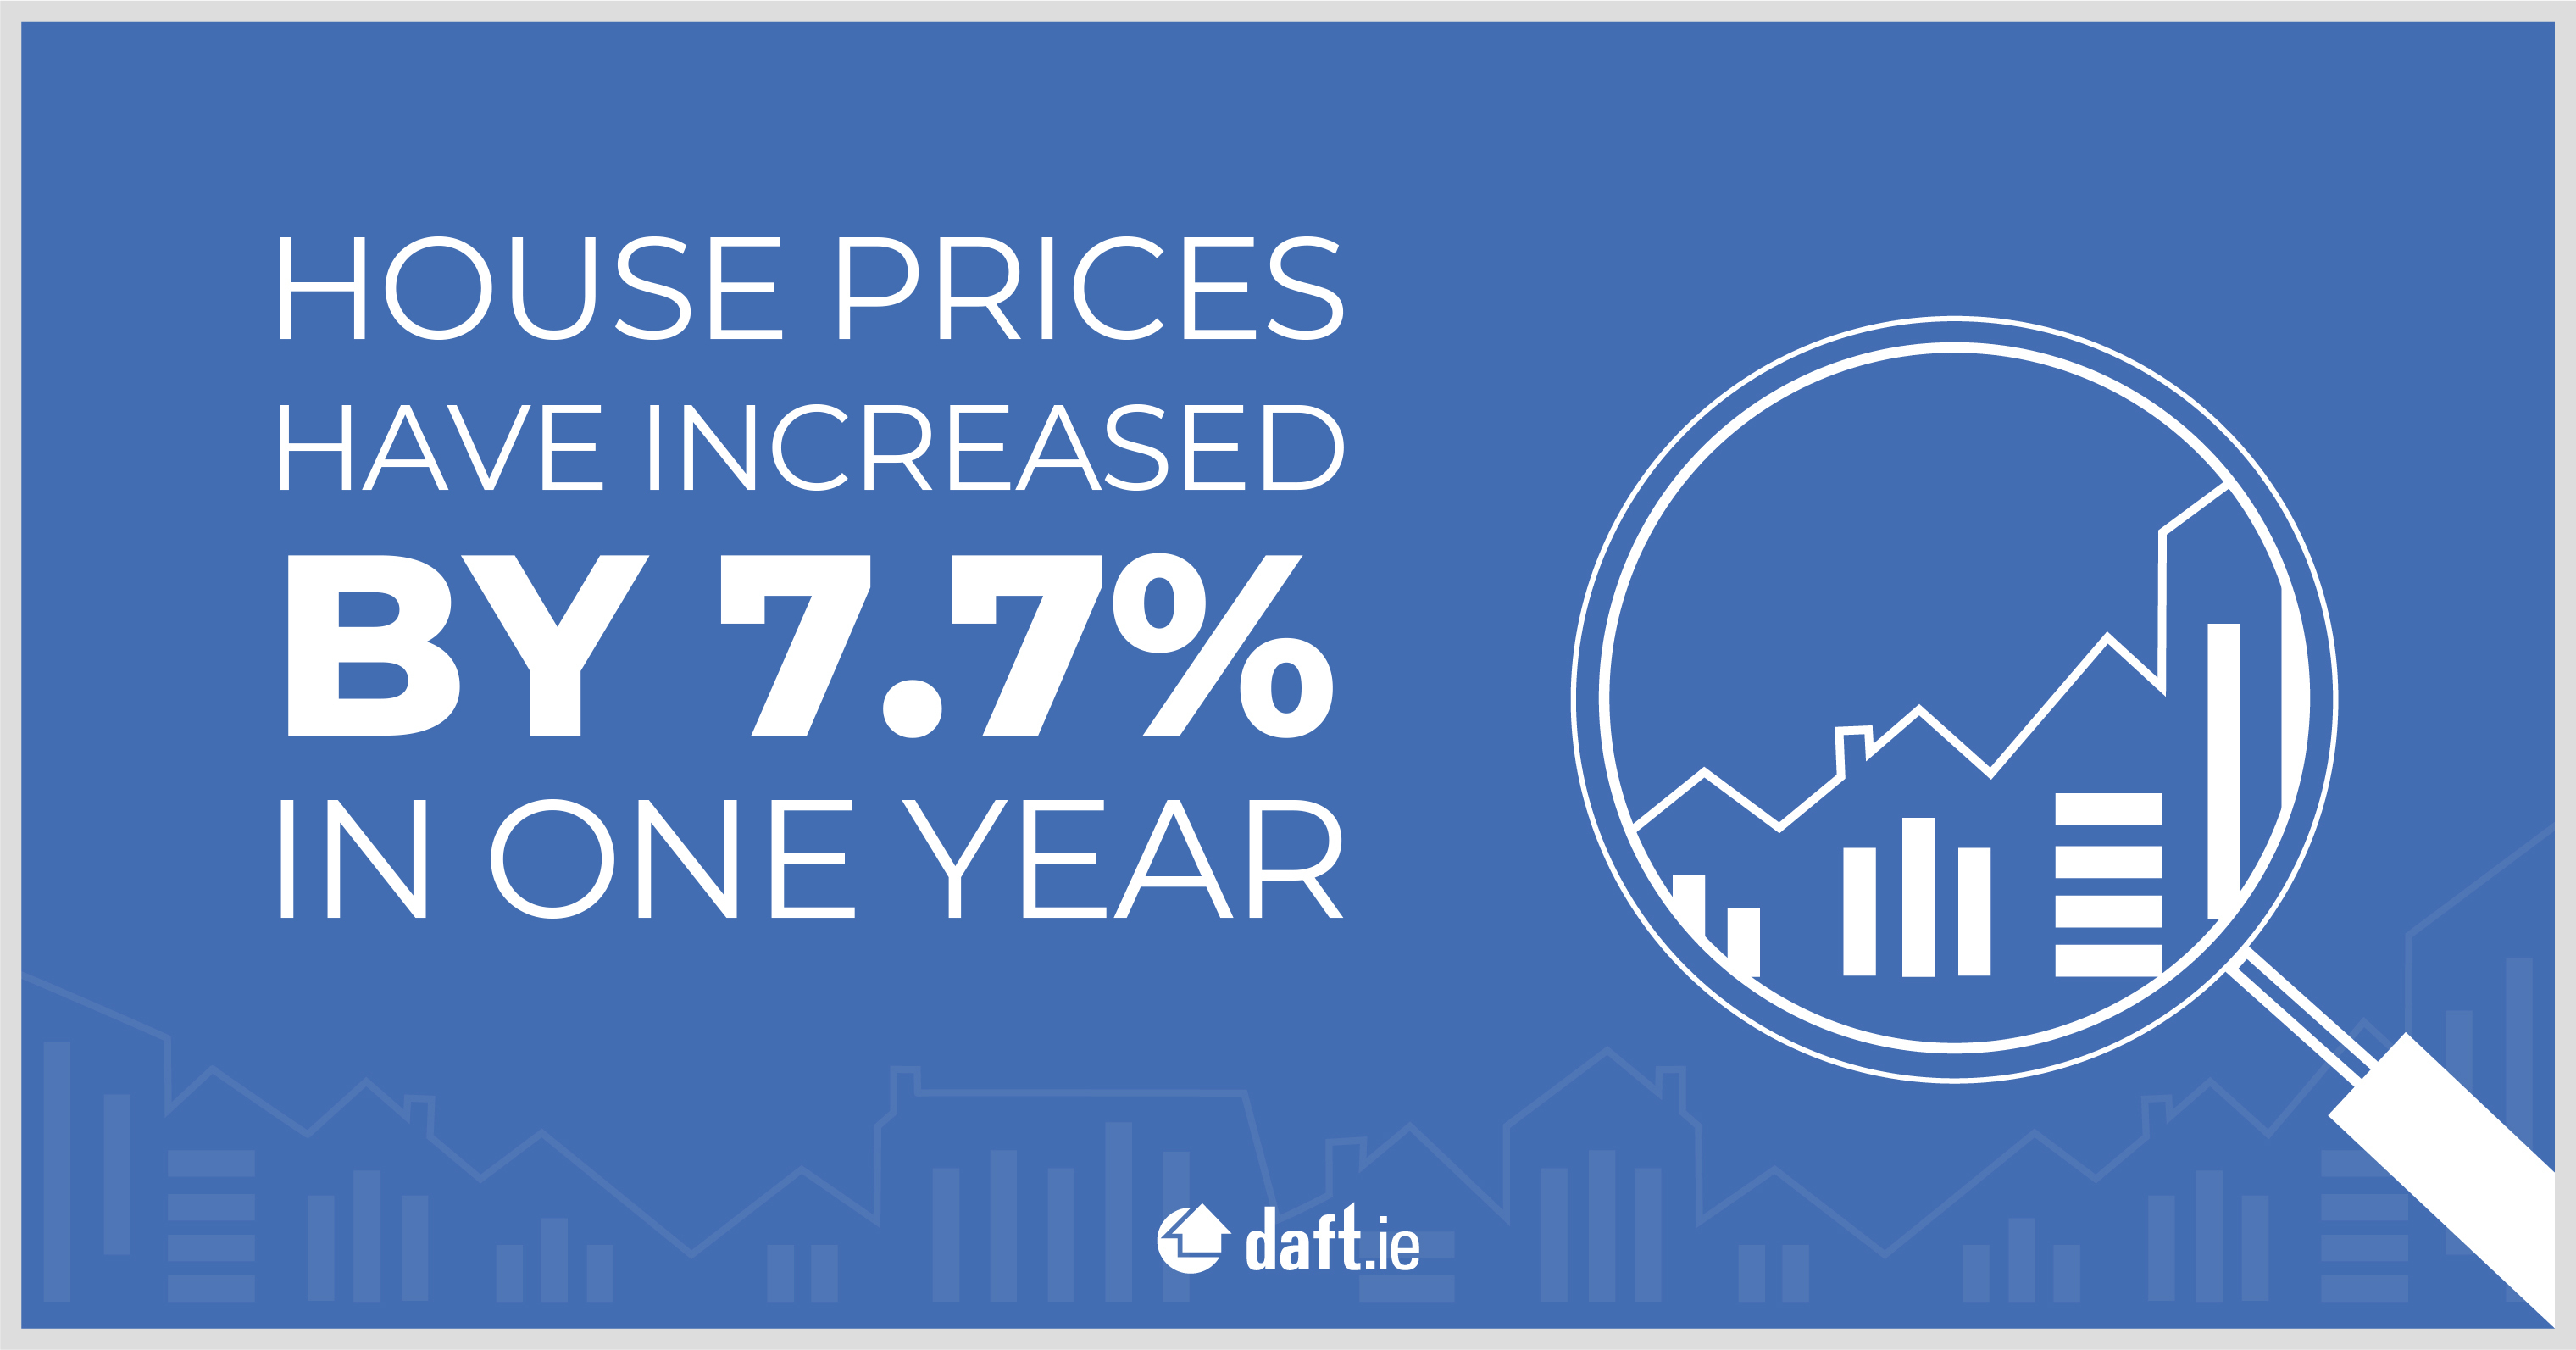
It seems somehow fitting that ‐ in a year that was determinedly far too like its predecessor despite everyone's hope things would move on ‐ the measured annual change in prices contained in this year-end report for 2021 is at 7.7% the same as in 2020. Indeed, the rate is ‐ uncannily ‐ almost exactly the same as the average for the four-year period 2015-2018 (7.8%). So, nothing but the same old story, you might say, about the sales market in Ireland this year.

Those four years ‐ from 2015 to 2018 ‐ formed the period after Central Bank rules had calmed down the housing market but before the ramp-up in supply had had its effect. It is perhaps largely forgotten now but the country very nearly went down the path of another housing bubble in the mid-2010s, less than a decade after the last bubble burst. In Dublin, the annual change in housing prices had flipped from -22% in 2011 to +22% by mid-2014. In the third quarter of 2014, the Daft Report showed that prices in Dublin had risen by just under 25% in one year. The average price in South County Dublin, for example, rose by more than €100,000 in just twelve months, from €408,000 in 2013Q3 to €512,000 a year later.
As summer turned to autumn that year, the Central Bank realised it had to take action to control conditions in the credit market ‐ in particular the amount of leverage households were able to take on, the key problem in the 2001-2007 bubble ‐ and thereby rein in expectations of future price increases, an amplifier of swings in prices up and down. Prices ever since have, thankfully, largely been free of any swings in leverage conditions, with the minimum deposit required by borrowers effectively fixed at 2014 rates.
But while prices are no longer subject to the volatile gusts of credit conditions and changing expectations, they are still subject to the more fundamental headwinds and tailwinds that are demand and supply. And, with the Celtic Phoenix in full swing in the latter half of the 2010s, with incomes rising, employment soaring and a return to strong net migration, the fundamentals of demand were certainly strong.

And yet annual inflation fell from a peak of 12% in mid-2017 to zero by the third quarter of 2019 and even negative, an average of -1.2%, in the final quarter of 2019 ‐ and this is before any inkling that covid19 would wreak havoc on Irish society the following year. The answer lies in steadily improving the supply of new homes. In 2014, fewer than 5,000 new homes were transacted on the open market. By 2016, this had risen to just under 6,000 but the market was just getting started. In both 2018 and 2019, nearly 10,200 new homes were transacted on the open market.
The doubling of supply of new homes to buy on the open market belies concerns by some that malign forces are conspiring to prevent first-time buyers from accessing homes to own. More than that, the doubling of new homes was enough to halt inflation. At an elevated price point, certainly, but for the first time in a long time, the sales market showed signs of balance.
Covid19 disrupted all of that. At the very start, it seemed as though the pandemic might turn a gentle fall in prices into a full-on crash. But this version of the future lasted a couple of months at most ‐ a 4.3% fall in prices in Galway city between March and June 2020 was more than reversed with a 10.1% rise between June and September, easily the largest three-month gain in prices in a series stretching back to the start of 2006. In general, the annual change in prices during 2020 was largely the same.
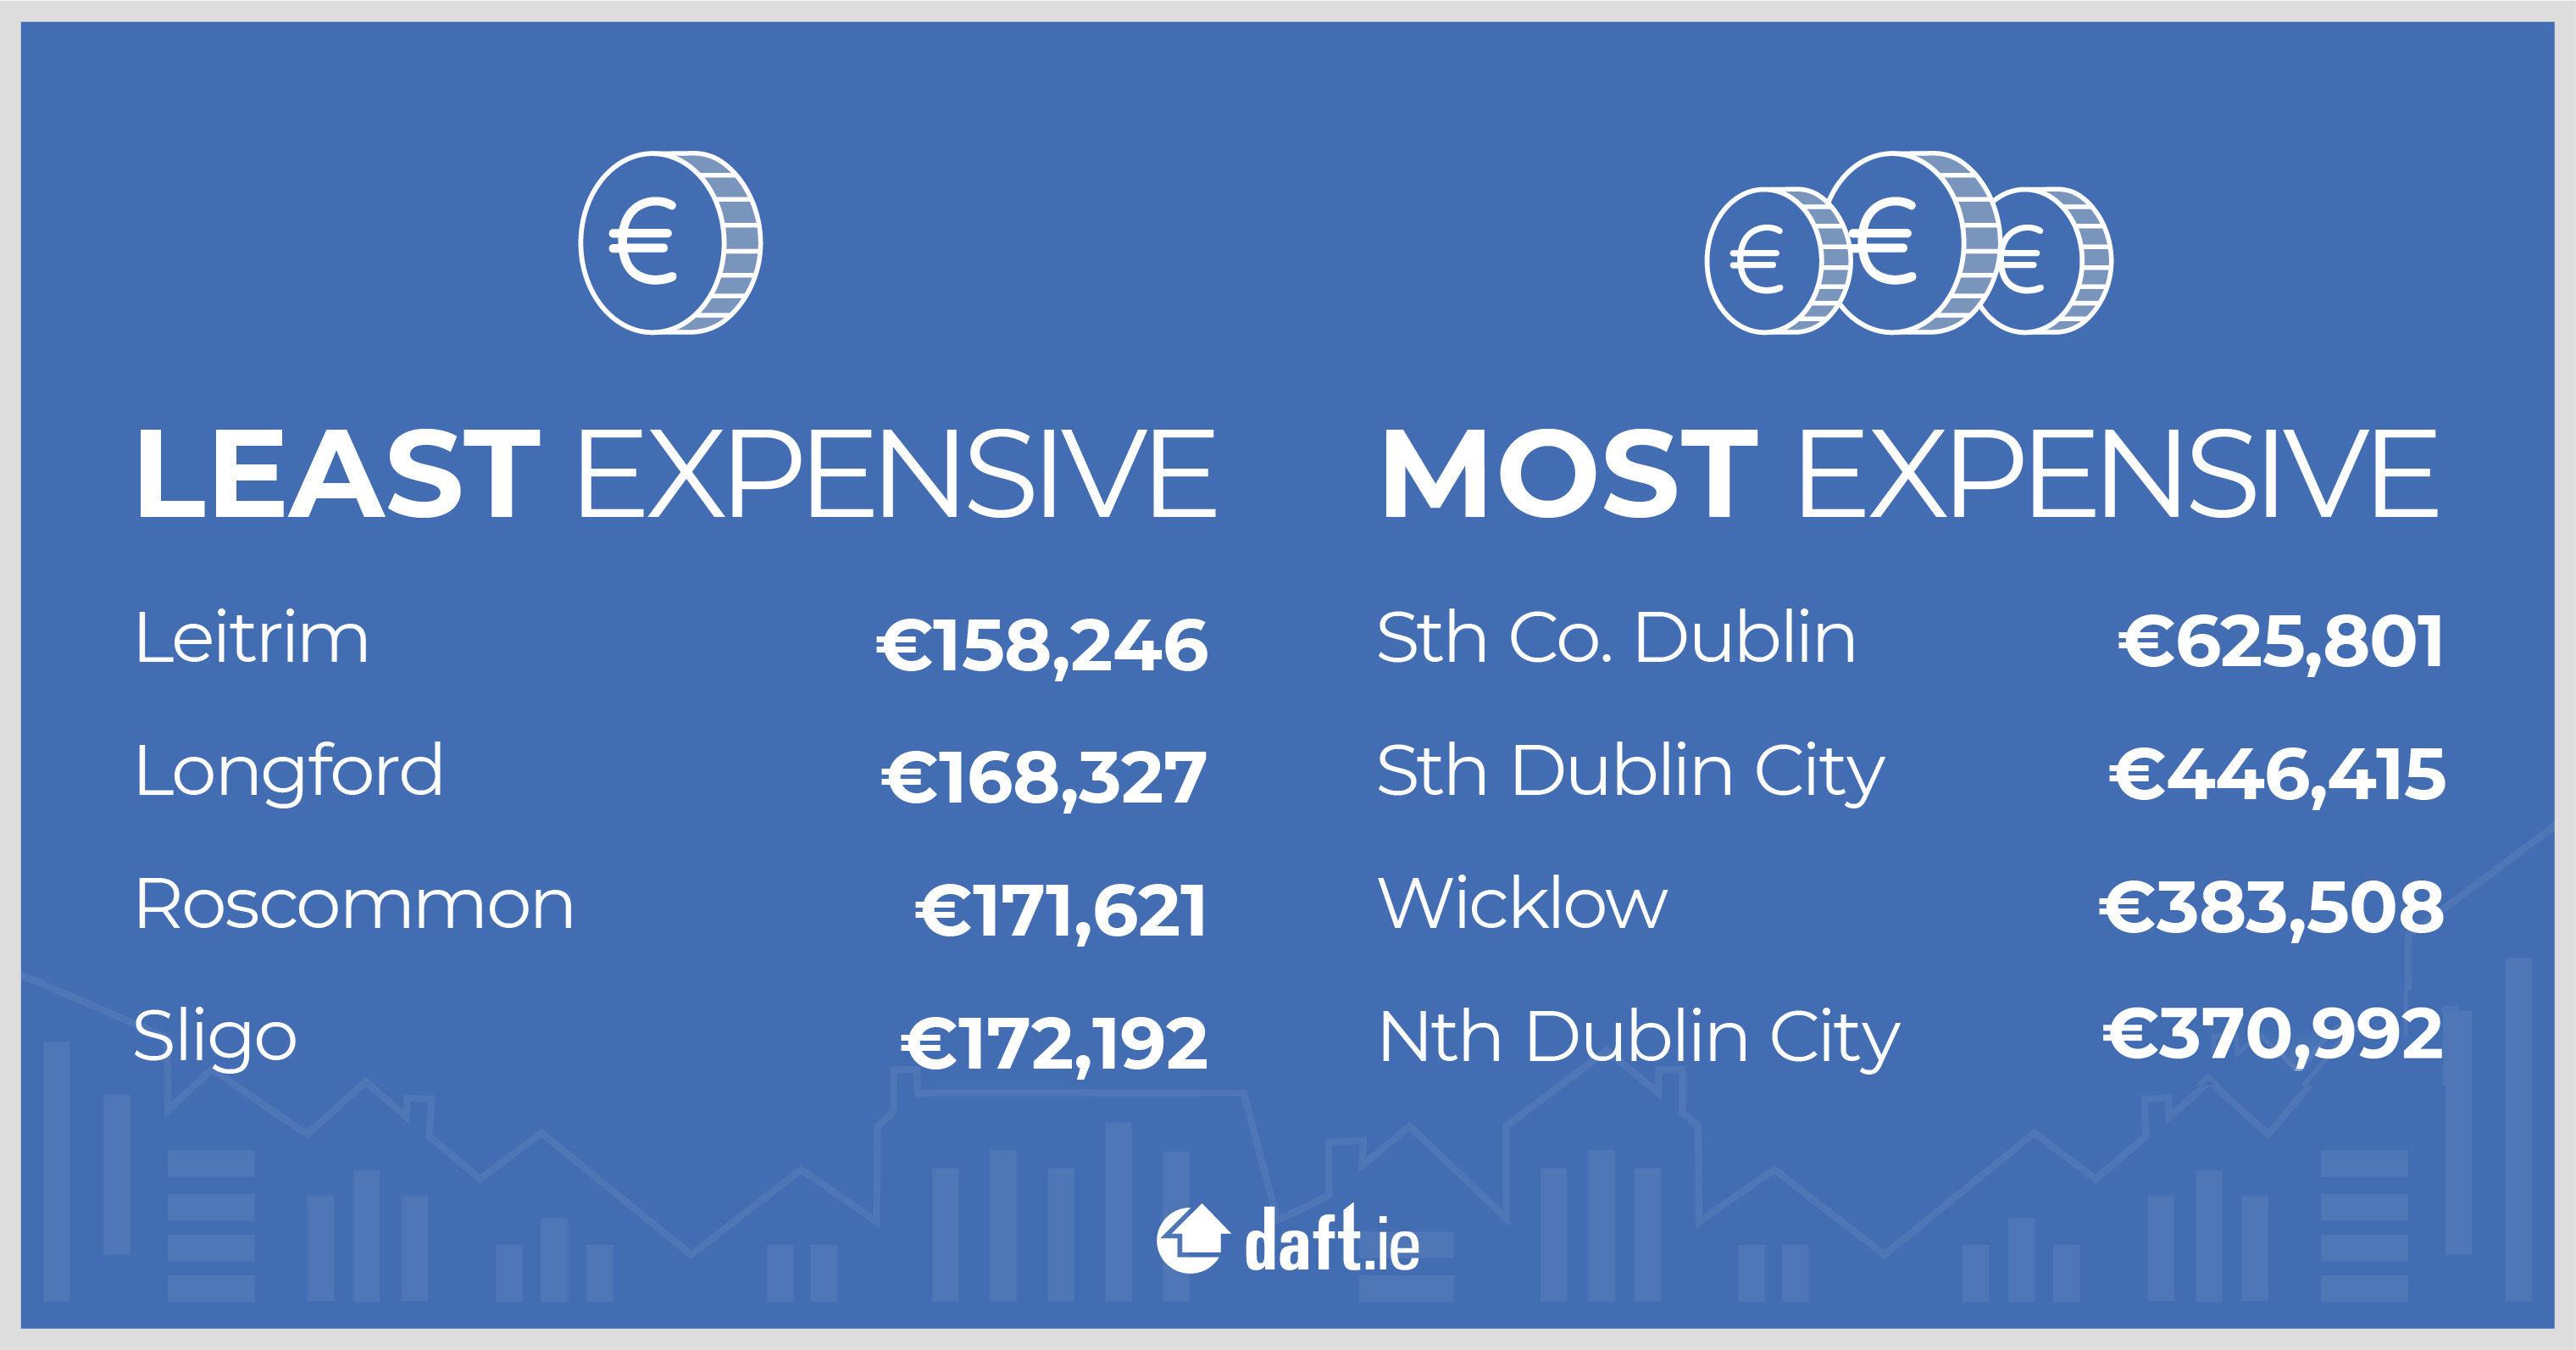
2021 saw the upward trend in prices continue ‐ but with a bit of a twist, as speculation that buyers would move further from work, to where homes were cheaper, started being seen in the data. 2021 ends with year-on-year inflation in all but one of the 54 markets covered in the Daft Report ‐ the exception being Dublin 6. But inflation in Dublin ‐ at 3.4% - and Galway city ‐ at 1.6% - is below inflation in their surrounding areas. Inflation in Dublin's commuter counties is running at 11% while inflation in Galway county is nearly 16%. The largest increases are in the cheapest markets, with Leitrim, for example, seeing a 19% increase in prices during the year.
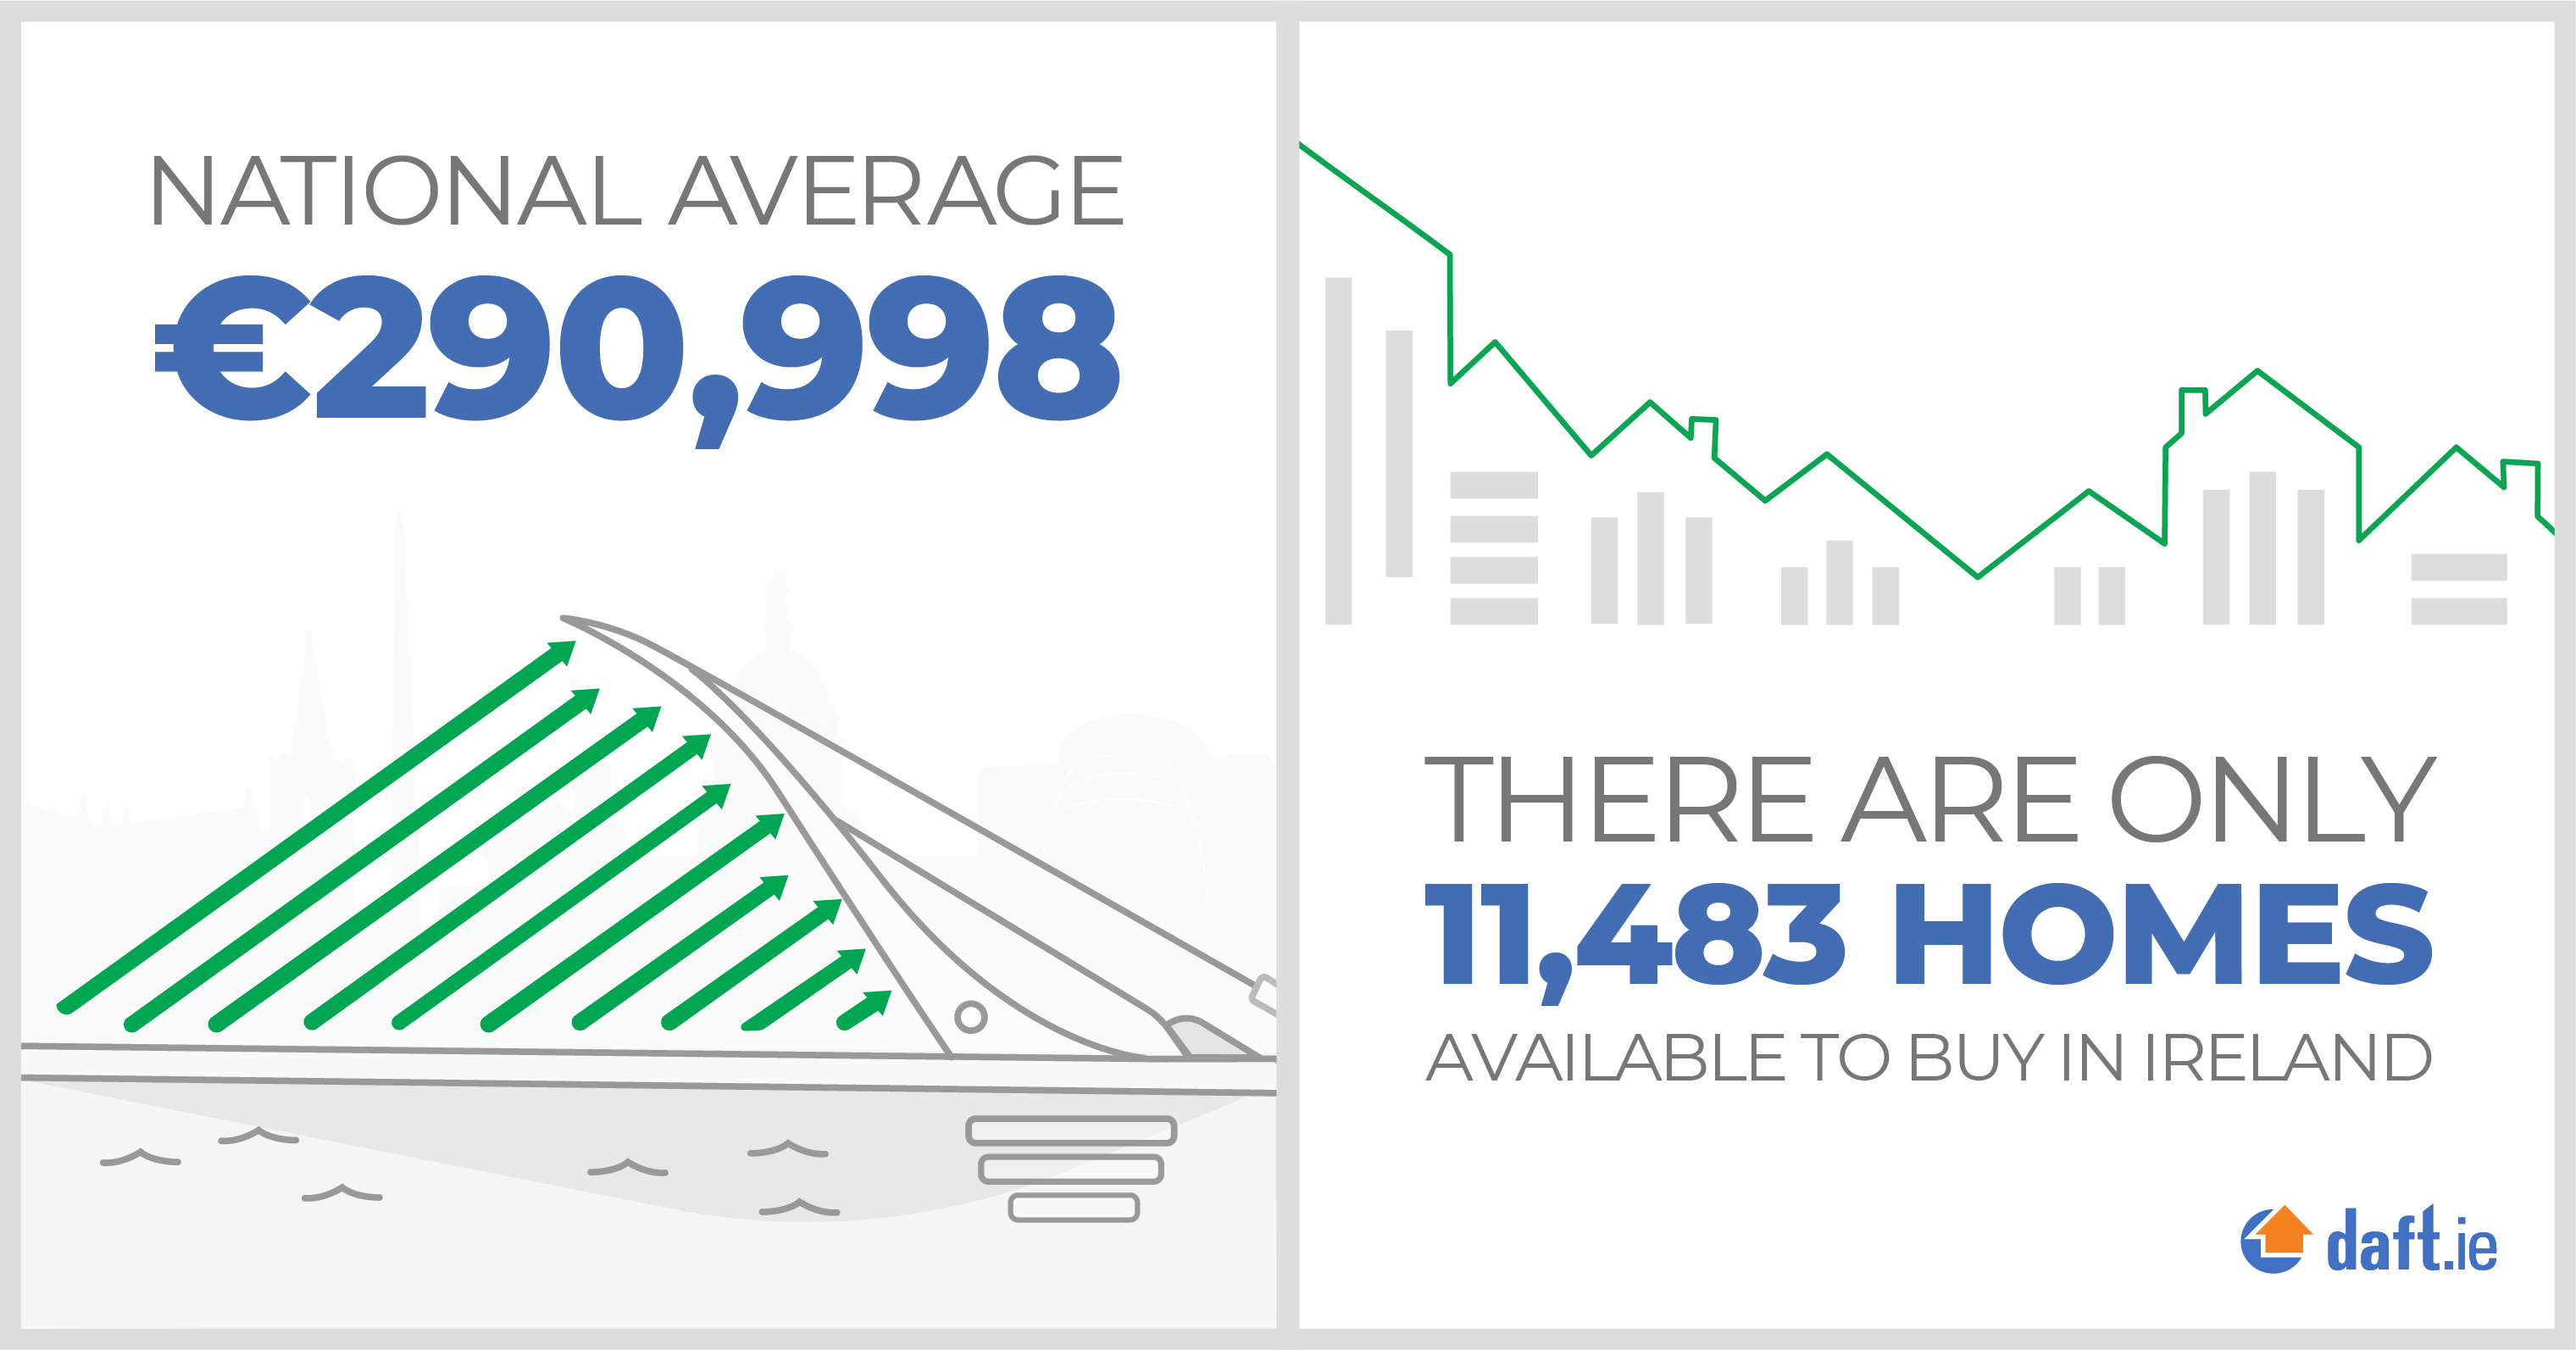
But while regional differences are likely to make the headlines, the main takeaway looking back at the year that was 2021 is perhaps instead a similarity across markets rather than differences between them. Fewer than 11,500 homes were available to buy online on December 1st, the lowest figure recorded since the rise of online listings at the end of the last bubble. In most parts of the country, the number of homes available to buy at the start of the month was at an all-time low. In Dublin, that was not the case ‐ but only because Dublin has been struggling with huge shortages of housing since 2015.

Covid19 has shaken up Ireland's housing market ‐ that is for sure ‐ but the underlying dynamic of weak supply given strong demand hasn't gone away. While supply seems set to improve over coming years, easing pressure in the market, we will no doubt see more signs of a system under pressure before things turn.
