Irish House Price Report Q2 2022 | Daft.ie
Daft Reports
- Ronan Lyons (House Price, Q1 2024)
- Ronan Lyons (Rental Price, Q4 2023)
- Ronan Lyons (House Price, Q4 2023)
- Ronan Lyons (Rental Price, Q3 2023)
- Ronan Lyons (House Price, Q3 2023)
- Ronan Lyons (Rental Price, Q2 2023)
- Ronan Lyons (House Price, Q2 2023)
- Ronan Lyons (Rental Price, Q1 2023)
- Ronan Lyons (House Price, Q1 2023)
- Ronan Lyons (Rental Price, Q4 2022)
- Ronan Lyons (House Price, Q4 2022)
- Ronan Lyons (Rental Price, Q3 2022)
- Ronan Lyons (House Price, Q3 2022)
- Ronan Lyons (Rental Price, Q2 2022)
- Ronan Lyons (House Price, Q2 2022)
- Ronan Lyons (Rental Price, Q1 2022)
- Ronan Lyons (House Price, Q1 2022)
- Ronan Lyons (Rental, Q4 2021)
- Ronan Lyons (House Price, Q4 2021)
- Ronan Lyons (Rental, Q3 2021)
- Ronan Lyons (House Price, Q3 2021)
- Ronan Lyons (Rental, Q2 2021)
- Ronan Lyons (House Price, Q2 2021)
- Ronan Lyons (Rental, Q1 2021)
- Ronan Lyons (House Price, Q1 2021)
- Ronan Lyons (Rental, Q4 2020)
- Ronan Lyons (House Price, Q4 2020)
- Ronan Lyons (Wealth, H2 2020)
- Ronan Lyons (Rental, Q3 2020)
- Ronan Lyons (House Price, Q3 2020)
- Ronan Lyons (Housing, July 2020)
- Ronan Lyons (Housing, June 2020)
- Ronan Lyons (Housing, May 2020)
- Ronan Lyons (Rental, Q1 2020)
- Ronan Lyons (House Price, Q1 2020)
- Ronan Lyons (Rental, Q4 2019)
- Ronan Lyons (House Price, Q4 2019)
- Ronan Lyons (Wealth, H2 2019)
- Ronan Lyons (Rental, Q3 2019)
- Ronan Lyons (House Price, Q3 2019)
- Pierre Yimbog (Rental, Q2 2019)
- Ronan Lyons (House Price, Q2 2019)
- Ronan Lyons (Wealth, H1 2019)
- Ronan Lyons (Rental, Q1 2019)
- Ronan Lyons (House Price, Q1 2019)
- Ronan Lyons (Rental, Q4 2018)
- Ronan Lyons (House Price, Q4 2018)
- Ronan Lyons (Wealth, H2 2018)
- Ronan Lyons (Rental, Q3 2018)
- Ronan Lyons (House Price, Q3 2018)
- Shane De Rís (Rental, Q2 2018)
- Ronan Lyons (House Price, Q2 2018)
- Ronan Lyons (Wealth, 2018)
- Ronan Lyons (Rental, Q1 2018)
- Ronan Lyons (House Price, Q1 2018)
- Ronan Lyons (Rental, Q4 2017)
- Ronan Lyons (House Price, Q4 2017)
- Ronan Lyons (Rental, Q3 2017)
- Ronan Lyons (House Price, Q3 2017)
- Katie Ascough (Rental, Q2 2017)
- Ronan Lyons (Wealth, 2017)
- Ronan Lyons (House Price, Q2 2017)
- Ronan Lyons (Rental, Q1 2017)
- Ronan Lyons (House Price, Q1 2017)
- Ronan Lyons (Rental, Q4 2016)
- Ronan Lyons (House Price, Q4 2016)
- Ronan Lyons (Rental, Q3 2016)
- Ronan Lyons (House Price, Q3 2016)
- Ronan Lyons (School Report, 2016)
- Conor Viscardi (Rental, Q2 2016)
- Ronan Lyons (Rail Report, 2016)
- Ronan Lyons (House Price, Q2 2016)
- Ronan Lyons (Rental, Q1 2016)
- Ronan Lyons (House Price, Q1 2016)
- Ronan Lyons (Rental, Q4 2015)
- Ronan Lyons (House Price, Q4 2015)
- Ronan Lyons (Rental, Q3 2015)
- Ronan Lyons (House Price, Q3 2015)
- Marcus O'Halloran (Rental, Q2 2015)
- Ronan Lyons (House Price, Q2 2015)
- Ronan Lyons (Rental, Q1 2015)
- Ronan Lyons (House Price, Q1 2015)
- Ronan Lyons (Rental, Q4 2014)
- Ronan Lyons (House Price, Q4 2014)
- Ronan Lyons (Rental, Q3 2014)
- Ronan Lyons (House Price, Q3 2014)
- Domhnall McGlacken-Byrne (Rental, Q2 2014)
- Ronan Lyons (House Price, Q2 2014)
- Ronan Lyons (Rental, Q1 2014)
- Ronan Lyons (House Price, Q1 2014)
- Ronan Lyons (Rental, Q4 2013)
- Ronan Lyons (House Price, Q4 2013)
- Ronan Lyons (Rental, Q3 2013)
- Ronan Lyons (House Price, Q3 2013)
- Ronan Lyons (Rental, Q2 2013)
- Ronan Lyons (House Price, Q2 2013)
- Ronan Lyons (Rental, Q1 2013)
- Ronan Lyons (House Price, Q1 2013)
- Ronan Lyons (Rental, Q4 2012)
- Ronan Lyons (House Price, Q4 2012)
- Lorcan Sirr (Rental, Q3 2012)
- Padraic Kenna (House Price, Q3 2012)
- John Logue (Rental, Q2 2012)
- Ronan Lyons (House Price, Q2 2012)
- Barry O'Leary (Rental, Q1 2012)
- Seamus Coffey (House Price, Q1 2012)
- Joan Burton (Rental, Q4 2011)
- Ronan Lyons (House Price, Q4 2011)
- Philip O'Sullivan (Rental, Q3 2011)
- Sheila O'Flanagan (House Price, Q3 2011)
- Rachel Breslin (Rental, Q2 2011)
- Constantin Gurdgiev (House Price, Q2 2011)
- Cormac Lucey (Rental, Q1 2011)
- Eoin Fahy (House Price, Q1 2011)
- Lorcan Roche Kelly (Rental, Q4 2010)
- Ronan Lyons (House Price, Q4 2010)
- John Fitzgerald (Rental, Q3 2010)
- Patrick Koucheravy (House Price, Q3 2010)
- Gary Redmond (Rental, Q2 2010)
- Jim Power (House Price, Q2 2010)
- Jill Kerby (Rental, Q1 2010)
- Brian Lucey (House Price, Q1 2010)
- Michael Taft (Rental, Q4 2009)
- Alan McQuaid (House Price, Q4 2009)
- Dr. Charles J. Larkin (Rental, Q3 2009)
- Emer O'Siochru (House Price, Q3 2009)
- Ronan Lyons (Rental, Q2 2009)
- Oliver Gilvarry (House Price, Q2 2009)
- Brian Devine (Rental, Q1 2009)
- Dr. Liam Delaney (House Price, Q1 2009)
- Gerard O'Neill (Rental, Q4 2008)
- Ronan Lyons (House Price, Q4 2008)
- Dr. Stephen Kinsella (Rental, Q3 2008)
- Moore McDowell (House Price, Q3 2008)
- Shane Kelly (Rental, Q2 2008)
- Fergal O'Brien (House Price, Q2 2008)
- Eoin O'Sullivan (Rental, Q1 2008)
- Dermot O'Leary (House Price, Q1 2008)
- Dan O'Brien (Rental, Q4 2007)
- Frances Ruane (House Price, Q4 2007)
- John McCartney (Rental, Q3 2007)
- Ronnie O'Toole (House Price, Q3 2007)
- Ronan Lyons (Rental, Q2 2007)
- Constantin Gurdgiev (House Price, Q2 2007)
- Fintan McNamara (Rental, Q1 2007)
- Rossa White (House Price, Q1 2007)
- Geoff Tucker (Rental, Q4 2006)
- Damien Kiberd (House Price, Q4 2006)
- Pat McArdle (House Price, Q3 2006)
- Marc Coleman (House Price, Q2 2006)
- David Duffy (House Price, Q1 2006)
- Austin Hughes (House Price, Q4 2005)
- David McWilliams (House Price, Q2 2005)

27th Jun 2022
Sentiment and the housing market
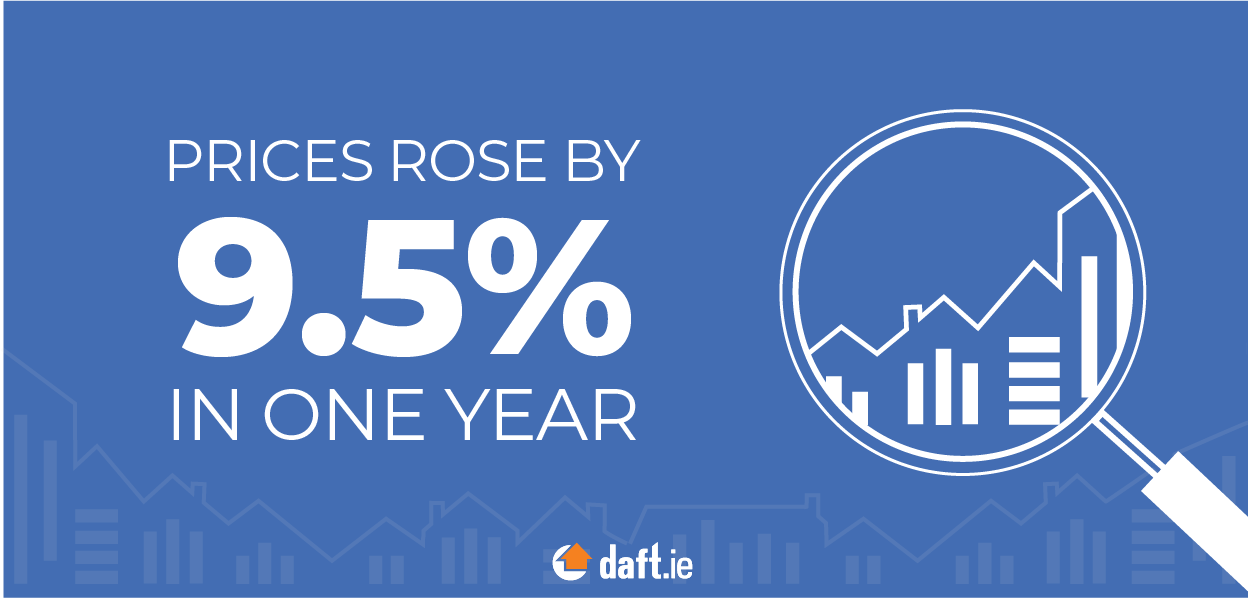
On the face of it, the headline figures in this latest Daft.ie Sales Report suggest little has changed since the previous edition in late March. The annual rate of inflation in housing prices, nationally, was 9.5% in the second quarter of 2022, up slightly from the Q1 figure of 8.9% but in effect marking the fourth consecutive quarter where inflation stood at close to 9%.

True, there has been a subtle change in the regions driving annual inflation: urban inflation is on the rise, while inflation outside the five main cities is cooling off. Inflation in Dublin has nearly doubled from 3.4% six months ago to 6.6%, while inflation in the four other cities has more than doubled ‐ from 5% at the end of last year to 11.1% now. Meanwhile inflation outside the cities has eased back a little, from 12.2% to 11.4%.

But in general, one might be tempted to conclude that little is different. After all, of the 54 markets covered in the report, prices are higher now than a year ago in 53 ‐ Dublin 17, always something of an outlier, is the only hold-out on this occasion, replacing Dublin 6, where prices had been falling for three quarters but are now rising again.
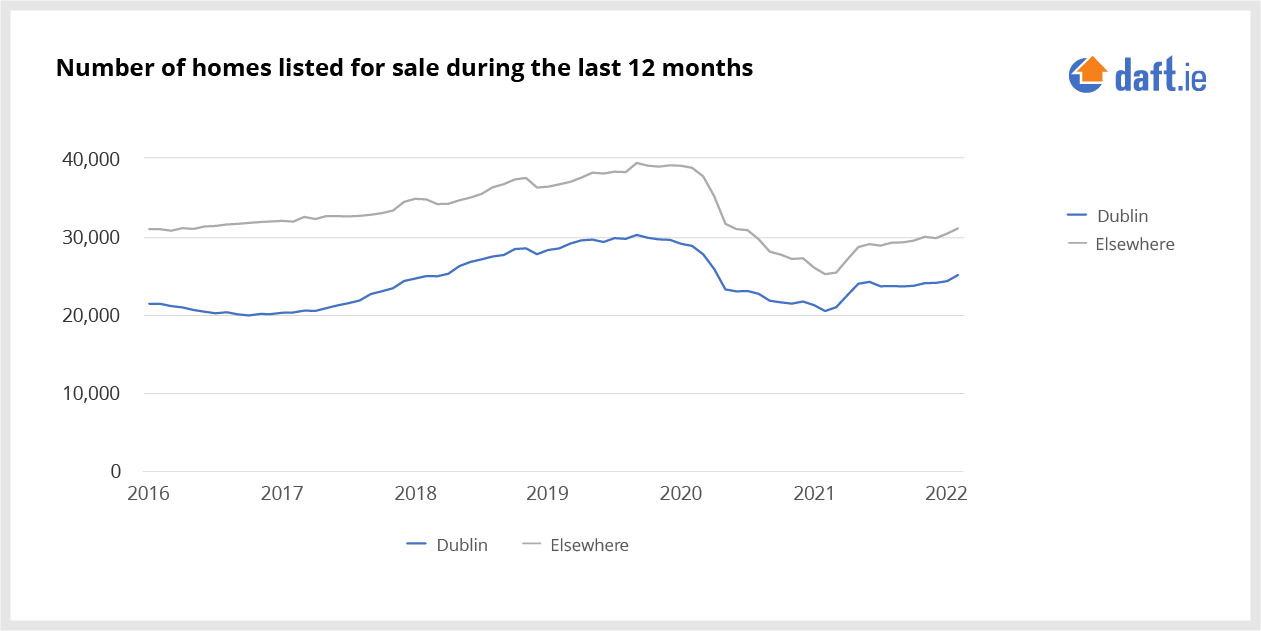
Figures on the availability of homes to buy, by and large, would support this conclusion. There were just over 12,400 homes available to buy at the start of June, effectively unchanged from the same date a year ago ‐ when just under 12,400 homes were available to buy. This is still a low total nationally in the context of the last decade. Between 2015 and 2020, there were on average almost 24,000 homes available to buy at any one time. This suggests that supply is tight compared to what the market had been used to over the last decade or so.
One thing to note, however, is that supply in Dublin ‐ and in the rest of Leinster ‐ has started to increase again. There were almost 5% more homes for sale in Dublin on June 1st this year compared to last year ‐ and the equivalent figure for the rest of the province was 10.8% more homes. After over two years of rapidly falling supply, it seems that the market around the capital has turned a corner in terms of availability.

It could be argued, indeed, that the chronic woes of the rental sector in the Greater Dublin Area ‐ and indeed the rest of Ireland ‐ mask the changing fortunes of the sale sector, even though the concept of a newly married couple, keen to buy a home and start a family, dominates public discourse on housing policy. Rental availability is at an extraordinary low level, while the availability of homes to buy has improved in recent months.
Looking at the flow of homes on to the market ‐ rather than the stock available at any particular time ‐ is a more direct window on to supply. In the twelve months to May 2022, just under 60,000 homes were advertised for sale nationwide. That is up from 52,700 a year previously and a low of less than 46,000 in the year to February 2021. The market is still somewhat off its pre-covid 12-month total of 65,000 ‐ but recovery, in terms of fresh supply, is well underway and perhaps even almost complete.
The re-emergence of urban housing in both price and supply metrics suggests a normalization of housing, post-covid19, is well underway. That is not to say things will revert to how they were in 2019 and before. Rather, as life settles down to a new normal, the shift in the housing market ‐ in particular the shift in housing demand by those capable of remote work ‐ looks largely complete. Over the last two years, prices in places like Wexford and Roscommon have increased by one third, while prices in Dublin increased by 'just' 15%.
This in effect means that there has been a leveling off in overall inflation since the bottoming out of prices between 2012 and 2014. Pre-covid, Dublin had seen prices rise overall by 69% from their lowest point, while prices in Cavan had increased by just 53%. Now both counties have seen cumulative increases of 95%.

Looking ahead, it may not be supply that shapes the market over the rest of the year, but instead demand. On the one hand, interest rates are rising ‐ something that will feed into the mortgage market soon enough and which will temper demand from new buyers. Ironically, interest rate rises are normally associated with cooling off booms but these rises come at a time when sentiment is somewhat fragile ‐ on the back of war and supply chain disruption.
Indeed, one statistic jumps out from the Sentiment Survey undertaken every quarter as part of this report. For over a decade, the survey has asked respondents what they expect to happen the sale price of housing nationally over the next year. Since 2014 ‐ with a small wobble around the very start of covid ‐ the typical person active in the housing market has expected prices to rise. As recently as the first quarter of this year, respondents expected prices to rise by 5.1% on average. But respondents in the second quarter expected an increase of just 0.9%.
Whether and how this change in sentiment translates into weaker demand ‐ distinct from changes in interest rates themselves ‐ remains to be seen. But while supply shortages are not going anywhere soon, demand could be in focus soon enough.
